Contact us
Contact Nuveen
Thank you for your message. We will contact you shortly.

Since different asset classes involve different types of risk, diversifying your portfolio may help reduce overall portfolio volatility.1
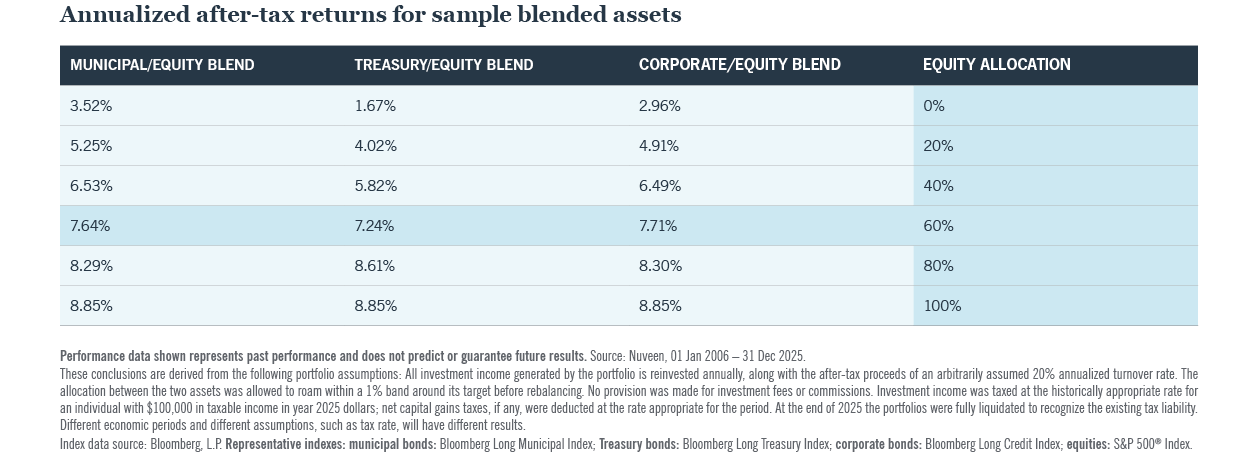
A balance of equities and municipal bonds has historically lowered the overall investment risk (measured by standard deviation) and provided similar after-tax returns compared with an all-equity portfolio.
Over the 20-year period from 2006 to 2025, a portfolio of municipal bonds and equities provided comparable after-tax returns with similar or less risk than equivalent Treasury or corporate blends.
40%/60% municipal/equity mix assumed less risk with similar return when compared with a 100% equity portfolio.

Assessing trade-offs among investments
Investments contain different sources of risk and return. Stocks can provide higher returns but also have greater volatility than municipal bonds. Municipal and corporate bonds include the individual credit risk of the borrower and the general interest rate risk of lower bond prices due to rising interest rates. Treasuries are backed by the full faith and credit of the U.S. government for the timely payment of principal and interest, but these securities are also subject to interest rate risk. Depending on an investor’s investment goals, risk tolerance, time horizon and tax implications, various portfolio considerations and allocations should be evaluated.
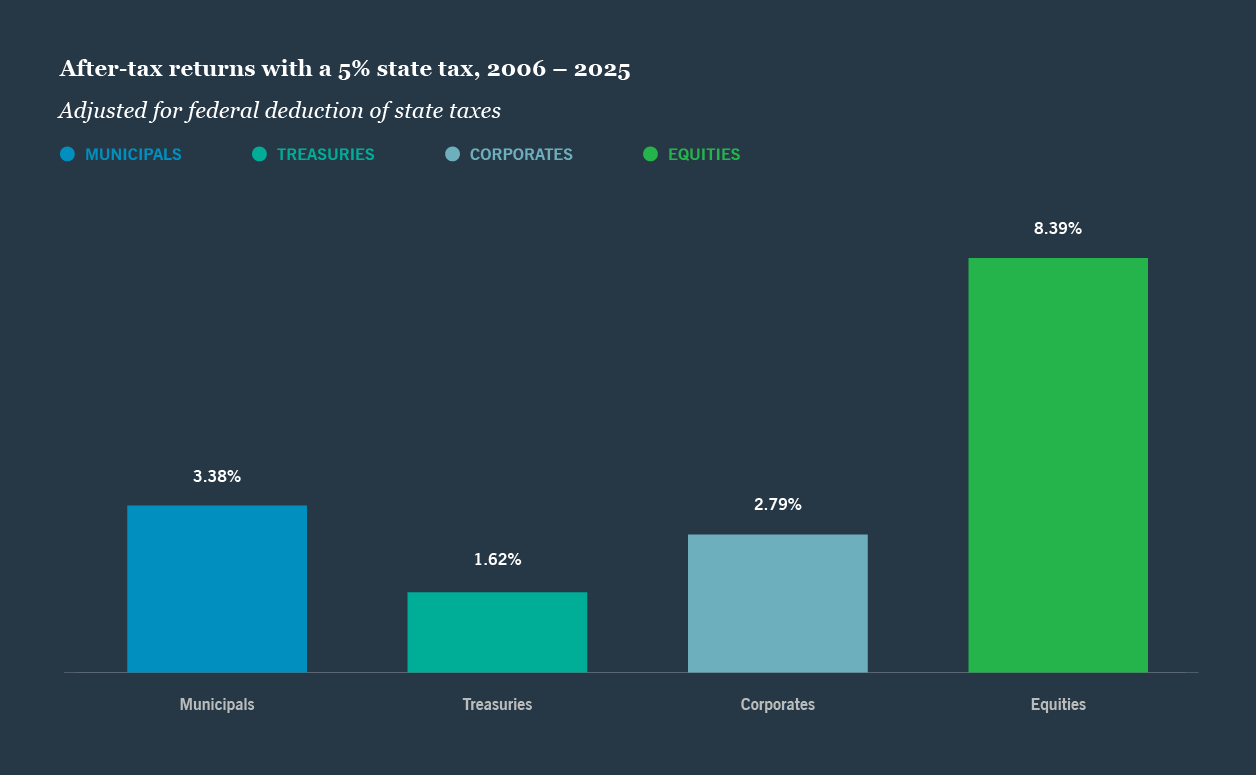
What does this mean at the state level?
As is typical in many states, realized capital gains are assumed to be taxed at the same rates as income. Due to the variation in state and local taxes, the impact on returns was not explicitly analyzed. The analysis assumed a 5% base state tax for both capital gains and income.6,7
Related articles


Contact us

You are on the site for: Financial Professionals and Individual Investors. You can switch to the site for: Institutional Investors or Global Investors
1 Diversification does not insure against loss in a declining market.
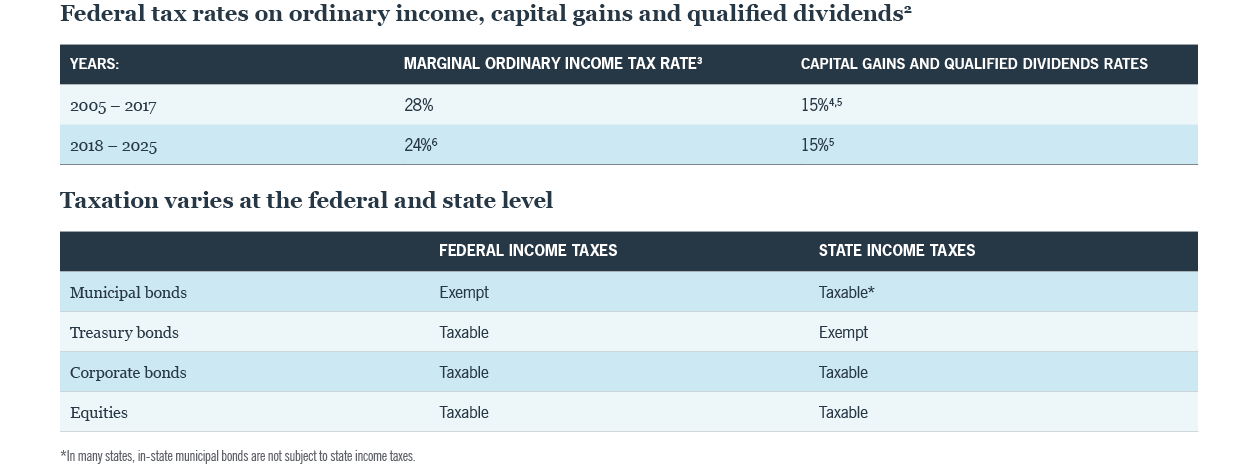
2 Historical tax rates were obtained from the respective annual IRS Schedule and are representative of those experienced by an investor who earned $100,000 in 2025 dollars throughout the period.
3 Interest income is still taxed at the individual’s income tax rate.
4 The Jobs and Growth Tax Relief Reconciliation Act of 2003 provided for capital gain and dividend tax relief to individual tax payers.
5 The maximum tax rate on capital gains and dividend income is 20% as of 31 Dec 2017 for the 39.6% tax bracket.
6 The Tax Cuts and Jobs Act of 2017 lowered the marginal ordinary income tax rate and capped state and local tax (SALT) deductions at $10,000, among other reductions.
7 Since state taxes are deductible from federal tax returns, the stated rate is slightly higher than the effective additional tax rate (state tax rate x [1 – federal income tax rate]).
This material is not intended to be a recommendation or investment advice, does not constitute a solicitation to buy, sell or hold a security or an investment strategy, and is not provided in a fiduciary capacity. The information provided does not take into account the specific objectives or circumstances of any particular investor, or suggest any specific course of action. Investment decisions should be made based on an investor’s objectives and circumstances and in consultation with his or her advisors.
The views and opinions expressed are for informational and educational purposes only as of the date of production/writing and may change without notice at any time based on numerous factors, such as market or other conditions, legal and regulatory developments, additional risks and uncertainties and may not come to pass. This material may contain “forward-looking” information that is not purely historical in nature. Such information may include, among other things, projections, forecasts, estimates of market returns, and proposed or expected portfolio composition. Any changes to assumptions that may have been made in preparing this material could have a material impact on the information presented herein by way of example. Performance data shown represents past performance and does not predict or guarantee future results. Investing involves risk; principal loss is possible.
All information has been obtained from sources believed to be reliable, but its accuracy is not guaranteed. There is no representation or warranty as to the current accuracy, reliability or completeness of, nor liability for, decisions based on such information and it should not be relied on as such. For term definitions and index descriptions, please access the glossary on nuveen.com. Please note, it is not possible to invest directly in an index.
This study is based on historical data gathered from sources we consider to be reliable and consistent. The methodology applied and results produced by this study indicate past investment performanceof market indexes over the 01 Jan 2006 – 31 Dec 2025 time period exclusively and in no way should be considered representative of the past performance of any investment product or predictive of future investment expectations and performancefor the municipal marketor investment products. Investorsshould consult with their professional advisors before making any tax or investment decisions.
Nuveen provides investment advisory services through its investment specialists.
This information does not constitute investment research as defined under MiFID.
Not registered yet? Register
You are about to access our website for visitors outside of the United States.
You are about to access our website for Nuveen Global Cities REIT
You are leaving the Nuveen website.
You are leaving the Nuveen website and going to the website of the MI 529 Advisor Plan, distributed by Nuveen Securities, LLC.The Nuveen website for institutional investors is available for you.
You are about to access our website for visitors outside of the United States.
You are about to access our website for Nuveen DMAT Cart
You are about to access our website for Nuveen Churchill Private Capital Income Fund (“NC - PCAP”)
