15 Aug 2022
0
Add funds
Fund 1
Fund 2
Fund 3
Fund 4
TOOLS
The Morningstar Fund Compare tool quickly evaluates different funds against one another. In addition to Nuveen funds, add any MF, CEF or ETF available from Morningstar. Important information and disclosures are included after you click Generate Report. Please ensure to enable pop-ups in your browser.
The Morningstar Portfolio Review tool compares and analyzes your portfolio holdings. In addition to Nuveen funds, add any MF, CEF or ETF available from Morningstar. Important information and disclosures are included after you click Generate Report. Please ensure to enable pop-ups in your browser.
Tools are currently unavailable for use on mobile. Please visit the desktop site.
Fund Compare
Quickly evaluate different MFs, CEFs and ETFs against one another
Portfolio Review
Generate a detailed analysis of your portfolio holdings including MFs, CEFs and ETFs
Municipal Bond Ladder Tool
Learn how a laddered portfolio may perform in rising rate environments
Contact us
Contact Nuveen
Thank You
Thank you for your message. We will contact you shortly.
Municipal Bonds
Rolling down the yield curve in up and down markets
Through active management, institutional investors in municipal bonds can employ professional strategies that seek to overcome market complexities and take advantage of profitable opportunities. One such strategy, which may be difficult for individual investors to implement due to transaction costs, is called “rolling down the yield curve.”
Returns may be enhanced by selling a bond at its peak price and rolling into a longer maturity bond. Two principles make this strategy viable:
- Bonds with longer maturities typically have higher yields to compensate investors for a longer period of uncertainty.
- Bonds with higher yields have lower prices, assuming coupon rates and maturity remain the same.
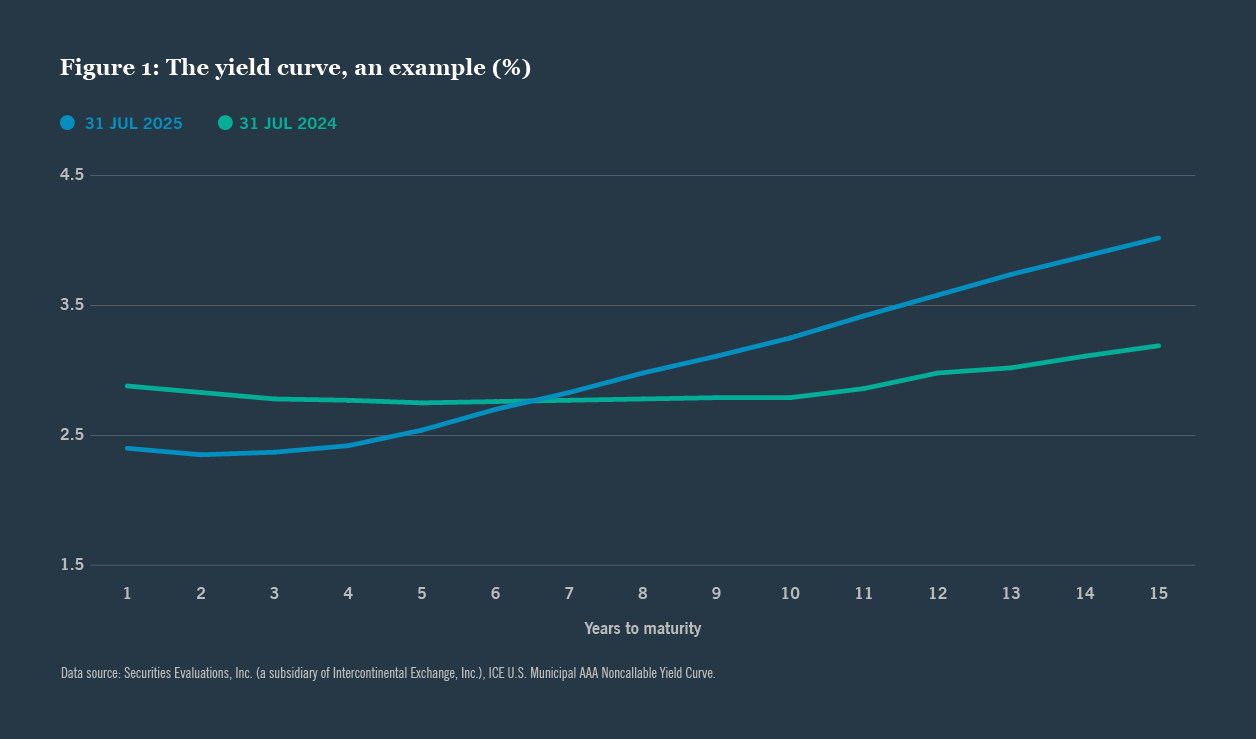
The yield curve
The first principle can be visualized by plotting a yield curve. If one charts yields on the Y-axis, and time to maturity on the X-axis, the resulting line will slope upward to the right, as shown in Figure 1.
The price of a bond
The second principle implies that the price of a bond will, for a time, rise as it approaches maturity because it will be priced to progressively lower yields. At some point, however, the price will start to decline because the need to eliminate the premium over shorter and shorter periods outweighs the effect of pricing to lower yields.
If a bond with a 2.50% coupon is priced to yield 2.00% (as a result, for example, of a change in interest rates or because the bond is now being priced to a shorter maturity), the bond will be priced above par. The difference between the coupon rate and the yield (in this case 0.50%) will be roughly the amount by which the premium declines each year.
Thus, if the bond has four years until maturity, the dollar price will be about 102. But if the same bond has only two years to maturity, the dollar price will be about 101, since, at 0.50% per year, the one point premium will be fully amortized in two years. For the price to stay at 102 with two years until maturity, the yield would have to fall to 1.50%, which would be 1.00% lower than the coupon rate so that about 1.00% of premium would be amortized each year. Assuming that the yield curve remains unchanged, Figure 2 shows how the price of a bond changes over time simply as a result of rolling down the yield curve.
Portfolio managers may derive increased value by selling bonds with just a few years to maturity while their prices are still high. That generates more proceeds that can be reinvested into bonds with longer maturities and higher yields. The amount of benefit from this strategy depends on the slope of the yield curve and the timing of purchases and sales.
Illustration: How it works
Suppose that on 31 Jul 2022, the AAA rated, noncallable yield curve was as follows:
Further suppose that someone invests $100,000 in a bond with the following characteristics:
Ten years later, on 31 Jul 2032, if interest rates remain the same throughout the yield curve, the investor could sell that bond at a dollar price of $105.334 based on the fact that bonds with 5 years to maturity are priced to yield 1.79%. The proceeds of that sale could be used to purchase the new bond shown below (coupon rate rounded to nearest 0.01%).
By selling the original bond for more than par, the investor would be able to buy a premium bond with a higher coupon. Finally, in the year 2037 (15 years after the original investment and five years after the swap) the new bond has a dollar price of $108.921 (priced to yield 2.26% to maturity in 10 years). To summarize, below is the way the investor’s cash flows look:
Using these cash flows, we can compute the internal rate of return (IRR) on this investment, which is the interest rate that causes the present value of the amounts received to equal the amount invested. The IRR in this case is 3.50%. If the investor just held the original bond until it matured, the IRR would have been 2.91%, which is the yield at which the bond was purchased. Thus, by selling the bond with 5 years remaining to maturity and reinvesting in another 15-year bond, the investor increases the return by 0.59%.
What happens if interest rates fall?
Suppose, in our example, interest rates had fallen 0.50% sometime in the first 10 years after the bond was purchased and remained there for the remainder of the 15-year period. (Since the coupon stream remains constant until the bond is sold in year 10, all that matters is what the yield curve looks like in the last 5 years.) In 2032, the original bond would be worth $107.820 as it is priced to yield 1.29% (0.50% less than in the original scenario). This amount would be reinvested as follows:
What happens if interest rates rise?
We obtain similar results if we assume that yields rose by 0.50%. In that case, the original bond would be worth $102.913 after 10 years (priced in 2032 to yield 2.29% to maturity in 2037). The 0.50% increase in interest rates means that a new 15-year bond would yield 3.41%. Because the investor had more than $100,000 to spend, the new bond would be worth more than par, and would have a coupon rate of 3.67%, which is greater than its yield.
Explanation: Why it works
At first glance, this strategy sounds like the proverbial “free lunch,” but it has a logical explanation. If the investor were to hold the bond to maturity, the investor would have a security whose yield decreases over time. This lower yield reflects the fact that the price volatility of the bond, in other words, its market risk, would also be decreasing.
The principle in operation here is that the maturity of a bond affects how much the price changes in response to changing interest rates: the shorter the maturity, the less the change. By swapping into a longer bond in the tenth year, the investor replaces a lower yielding security with a higher yielding security. This higher yield compensates for the fact that the new bond has greater price volatility.
This trade, however, merely restores the volatility to the level of risk originally chosen by the investor. The investor substantially improves his return by taking advantage of the market’s preference for low volatility and by making judicious use of the shape of the yield curve in selecting maturities for sale and purchase.
Conclusion
By monitoring the shape of the yield curve and capturing the value produced when bonds ride the yield curve, portfolio managers can enhance the returns that investors receive from their portfolios in up and down markets.
Assumptions**
The preceding analysis is based on two assumptions. The first is that the yield curve retains its current slope. If the yield curve were steeper, the benefits of selling, in 2032, a bond due in 2037 and replacing it with a bond due in 2047 would be enhanced. On the other hand, a flatter yield curve would reduce the benefit of this strategy.
The slope of the current noncallable municipal yield curve is close to what it has been in recent years. As of 29 Jul 2022, the spread of 15-year yields over 5-year yields was 1.12% (2.91% - 1.79%), which was more than the average spread of 0.93% over the last 3 years.
The second assumption is that interest rates do not increase between 2032 and 2037. By the year 2037, the investor in the example would be holding a bond with 10 years remaining to maturity, while an investor who continued to hold the original bond would then be receiving the principal balance in cash. If rates on 10-year bonds increased between 2032 and 2037, the investor would, in many cases, be better off holding cash at the end of the period than holding a 10- year bond (depending on how high 10-year yields became).
On the other hand, if rates fell, the investor with a 10-year bond would enjoy appreciation not available to the investor who receives a return of principal in 2037. Since these risks are symmetrical, and their impact varies with the interest rate cycle, we believe the effect of changes in rates should average out if the strategy of rolling down the yield curve is consistently followed over time.
The effect of rate changes should average out if the strategy is consistently followed over time.
Related articles
Municipal Bonds
Which states have lost or
gained taxable income?
Under provisions of the Tax Cuts and Jobs Act of 2017 that are still in effect, the amount of state and local taxes (SALT) that can be deducted by individual taxpayers is limited to $10,000.
Municipal Bonds
Municipal market: How rates rise matters
At its May meeting, the U.S. Federal Reserve increased rates another 25 basis points. Many investors feel we are at or near the peak rate for this tightening cycle.
Municipal Bonds
Property, water and power impact muni bonds
Commercial real estate valuations for office space are declining in some markets, which may affect city property tax revenue.
**Source: Securities Evaluations, Inc. (a subsidiary of Intercontinental Exchange, Inc.)
These examples are hypothetical and in no way intended to represent the performance of any investment. The reader should not assume that investment in any securities or asset class listed in this report were or will be profitable. This report contains no recommendation to buy or sell any specific securities and should not be considered investment advice of any kind. Certain information was obtained from third party sources, which we believe reliable but not guaranteed.
Endnotes
The views and opinions expressed are for informational and educational purposes only as of the date of production/writing and may change without notice at any time based on numerous factors, such as market or other conditions, legal and regulatory developments, additional risks and uncertainties and may not come to pass. This material may contain “forward looking” information that is not purely historical in nature. Such information may include, among other things, projections, forecasts, estimates of market returns, and proposed or expected portfolio composition. Any changes to assumptions that may have been made in preparing this material could have a material impact on the information presented herein by way of example. Past performance is no guarantee of future results. Investing involves risk; principal loss is possible.
All information has been obtained from sources believed to be reliable, but its accuracy is not guaranteed. There is no representation or warranty as to the current accuracy, reliability or completeness of, nor liability for, decisions based on such information and it should not be relied on as such. For term definitions and index descriptions, please access the glossary on nuveen.com. Please note, it is not possible to invest directly in an index.
A word on risk
Investing involves risk; principal loss is possible. Investing in municipal bonds involves risks such as interest rate risk, credit risk and market risk. The value of the portfolio will fluctuate based on the value of the underlying securities. There are special risks associated with investments in high yield bonds, hedging activities and the potential use of leverage. Portfolios that include lower rated municipal bonds, commonly referred to as “high yield” or “junk” bonds, which are considered to be speculative, the credit and investment risk is heightened for the portfolio. Bond insurance guarantees only the payment of principal and interest on the bond when due, and not the value of the bonds themselves, which will fluctuate with the bond market and the financial success of the issuer and the insurer. No representation is made as to an insurer’s ability to meet their commitments. This information should not replace an investor’s consultation with a professional advisor regarding their tax situation. Nuveen Asset Management is not a tax advisor. Investors should contact a tax professional regarding the suitability of tax-exempt investments in their portfolio. If sold prior to maturity, municipal securities are subject to gain/losses based on the level of interest rates, market conditions and the credit quality of the issuer. Income may be subject to the alternative minimum tax (AMT) and/or state and local taxes, based on the state of residence. Income from municipal bonds held by a portfolio could be declared taxable because of unfavorable changes in tax laws, adverse interpretations by the Internal Revenue Service or state tax authorities, or noncompliant conduct of a bond issuer. It is important to review your investment objectives, risk tolerance and liquidity needs before choosing an investment style or manager.
Nuveen provides investment advisory solutions through its investment specialists.
Contact us
Financial professionals
Individual investors
You are on the site for: Financial Professionals and Individual Investors. You can switch to the site for: Institutional Investors or Global Investors
Please be advised, this content is restricted to financial professional access only.
Login or register as a financial professional to gain access to this information.
Not registered yet? Register