Contact us
Contact Nuveen
Thank you for your message. We will contact you shortly.

California capitalized on its previous economic expansion by growing reserves to historic levels. Since the last recession, it has repaid billions of dollars in budgetary borrowings, debt and deferrals; deposited surplus revenues into a rainy day fund; paid down other post-employment benefits (OPEB) and begun to prefund pensions. The state is better prepared to face the fiscal impacts of a slowing economy.
The state is better prepared to face the fiscal impacts of a slowing economy.
Institutionalized changes helped strengthen the state’s credit profile
Aside from general economic resurgence, the state’s credit profile improved with the following positive institutionalized changes:
Proposition 25 (2010) reduced the voting requirement to pass a budget in the California legislature from a super majority (two-thirds) to a simple majority (more than 50%) and would dock lawmakers’ pay when the budget is late, incentivizing on-time budget passages.
Proposition 2 (2014) put in place a more stringent rainy day fund aimed at smoothing out the state’s revenue volatility by requiring 1.5% of General Fund revenues plus any capital gains taxes that exceed 8% of General Fund revenues be deposited in the budget stabilization account (the “rainy day fund”). These funds must be used to repay the state’s budgetary borrowing and make excess payments toward state pensions and retiree health costs. Debt repayment is required through 2029, at which time the debt repayments become optional.
Proposition 30 (2012) and Proposition 55 (2016) Proposition 30 temporarily increased sales taxes by 0.25% to 7.5% from 01 Jan 2013 to 31 Dec 2016, and personal income taxes by 3% to 13.3% for the top tax bracket from 2012 to 2018. Passed in 2016, Proposition 55 extended the personal income tax portion of Proposition 30 for 12 additional years (through 2030).
These changes helped the state pass budgets on time over the last 14 years and build its rainy day fund while also paying down its debts and liabilities. Since the Great Recession, the state has capitalized on the economic recovery and taken steps to prepare itself for the next economic recession.
The enactment of Proposition 2 has allowed the state to build its total reserves from unfunded in 2009 to a projected $37.8 billion ($22.3 billion in Budget Stabilization Account, $10.8 billion in Public School System Account, $3.8 billion in State Operating Reserve and $900 million in Safety Net Reserve), which is at its constitutional maximum of 10% of General Fund revenues for fiscal year (FY) 2024. These actions have better prepared the state to handle a recession and earned it rating upgrades in 2019 to Aa2 by Moody’s Investors Service, AAby Standard and Poor’s and AA by Fitch Ratings.
Cash management tools are available
In addition to the measures taken to balance the budget, California has many tools available to help manage any cash flow disruptions. The state can access more than 800 of its 1,500 separate funds to borrow for cash flow needs totaling $66 billion of internal funds through FY24-25 as projected in the 2025-26 Governor’s Budget. It can also issue revenue anticipation notes (RANs) or revenue anticipation warrants (RAWs) to finance cash flow needs.
RANs are typically used to smooth out the timing difference between when revenues are collected and when bills are due. RAWs are issued in the absence of a budget. California has not issued RANs since FY15 and there are no plans to issue RANs through FY25-26. The state historically relied heavily on RANs to manage cash flows, so the lack of issuance demonstrates the state’s improved financial health. And if needed, the state can issue registered warrants (or IOUs), which it did back in 2009. However, the state is no longer allowed to issue long-term debt to fund operating deficits with the passage of Prop. 58 (2004).
Challenges led to budget deficits
The state’s General Fund posted a $1.4 billion surplus in FY231 but a net General Fund deficit of -$9.1 billion after transfers out. General Fund reserves ended at $64 billion, equal to 33.2% of General Fund revenues for FY23. Personal income taxes saw an 8.6% decline from the prior year with sales and use taxes and corporation taxes partially offsetting the decline with 1% and 2.3% growth, respectively. Total General Fund tax revenues fell $6.7 billion or 3.4% behind the prior year. Expenditures came in at $109 million, or essentially flat from FY22.
As FY23 began, risks to California’s economic and revenue outlook, identified in the 2022-23 Budget Act, were realized: continued high inflation, multiple Fed interest rate increases and further stock market declines. Declines in the stock market and market-based compensation have an outsized effect on the state’s revenue picture since the state relies heavily on personal income taxes and it has a progressive income tax structure.
The FY24-25 budget shortfall was due to two main factors: a decline in income tax collections and delayed tax receipts following the 2023 winter storms. The 2022 decline in the equity market resulted in the state collecting less in income taxes than projected. And while the stock market bounced back by late 2023, the state collected less tax revenue due to the “capital loss carryover,” which allows losses from previous years to offset capital gains or ordinary income in subsequent years, to reduce an individual’s overall tax liability. The winter storms resulted in the IRS extending tax filing deadlines for 99% of all California taxpayers. This made it difficult to forecast revenues accurately.
These challenges led to an estimated $31.7 billion budget deficit appearing in FY23-24, a $46.8 billion deficit in FY24-25 and $42 billion deficit in FY25- 26 (including $30 billion in early budget action in June 2024). This lies in stark contrast to estimated surpluses of $73 billion in FY21, $100 billion in FY22 and $49 billion in FY23 and the third consecutive year of deficit management.
The state’s enacted FY26 budget deficit is driven by economic uncertainty and market volatility from federal policy changes, resulting in forecasts of declining revenue from its primary sources: personal income, corporate income and sales taxes. Solutions to address the budget gap include significant reductions to the Medi-Cal program and other recurring expenses. These are on top of the early solutions which included spending cuts, temporary revenue increases, deferrals, delays and fund shifts, and a reserve draw.
The remaining reserves after the $7.1 billion budgeted draw in FY26 are projected to total $15.7 billion, or 7% of General Fund expenditures. This includes $11.2 billion in the budget stabilization account (BSA) (rainy day fund) and $4.5 billion in the special funds for economic uncertainty.
Where do the state’s finances stand today?
According to the state controller’s Fiscal Year-toDate 30 June 2025 State Cash Report, total General Fund revenues came in $3.7 billion or 1.6% ahead of the 2025-26 May Revision budget and up $18.1 billion or 8.4% above FYTD 30 Jun 2024. Revenues outperformed year-over-year due to the increase in two of the three largest tax revenue categories.
Personal income taxes and sales taxes came in above the prior year by 4.5% and 1.0%, respectively. FYTD 30 Jun 2025 expenditures came in below budget by $9.7 billion (-4.3%). Large swings in income tax collections are not out of the ordinary for the state and highlight the importance of recent measures governing reserve policies.
Preliminary numbers for July 2025 show state receipts outperformed budget estimates in the 2025-26 Budget Act by 3% and disbursements were flat to budget.
Pension funding has improved
California sponsors two retirement systems: the California Public Employees’ Retirement System (CalPERS) and the California State Teachers’ Retirement System (CalSTRS). The state has favorably made some progress to address its unfunded pension liabilities.
In September 2012, the California Public Employees’ Pension Reform Act (PEPRA) eliminated contribution holidays and retroactive benefit increases while prohibiting airtime (ability to buy extra years of service to count toward their pension benefits), increased current employee contributions, lowered defined benefit formulas and placed compensation limits on CalPERS members. These changes, now in place for over a decade, have improved funding levels.
Personal income taxes and sales taxes came in above the prior year by 4.5% and 1.0%, respectively.
A law passed in 2014, intended to eliminate the CalSTRS unfunded liability by 2046, requires increasing contributions each year. The state has also made additional supplemental pension contributions to both CalPERS and CalSTRS, above the required contributions during strong operating years. CalPERS funded ratio (amount of assets on hand to pay for obligations) was an estimated 75% for FY24, up over the prior year’s 72%. CalSTRS funded ratio was 75.8% for FY23, up from 74.4% the prior fiscal year.
The state’s total fixed costs, including debt service, pension contributions and retirement health care (other post-employment benefits or OPEB) contributions, were 7.2% of total governmental fund expenditures in FY23, down slightly over the prior year’s 7.5%. When compared to other states, California’s fixed costs for FY23 are higher than New York’s 4.6% but favorable compared to New Jersey’s 13.3%, Connecticut’s 23% and Illinois’ 16.3% (FY22).
California’s economy is large and diverse
California’s $3.36 trillion economy is the largest in the nation. It accounts for nearly 14.4% of U.S. GDP, and on a standalone basis would be the fourth largest in the world, according to the International Monetary Fund (IMF). The state’s real GDP grew by 3.6% in 2024, compared to the nation’s 2.8% increase over the prior year.
California’s economy is diverse and generally mirrors the nation’s economy with major components in high tech, trade, entertainment, manufacturing and tourism. Though the economy’s employment composition is similar to the U.S. overall, the state’s unemployment rate was 5.4% as of June 2025, exceeding the nation’s 4.1% during the same period.
Agriculture and forestry, retail trade, education and health services, and transportation sectors saw the largest job gains from June 2023 to June 2024. Areas of the economy contracting from June 2023 to June 2024 include mining and oil & gas, manufacturing, and wholesale trade.
California is an active issuer of municipal debt
California is the largest issuer of new municipal debt out of all fifty states. State issuance totaled $71.6 billion in 2024, according to The Bond Buyer. This accounts for 14.1% of 2024 issuance nationwide. The state issues two types of debt: general obligation (GO) and annual appropriation (lease revenue).
California state GO bonds are rated Aa2 by Moody’s, AA- by Standard and Poor’s and AA by Fitch Ratings. GO debt must be voter approved in a general election prior to issuance. Debt service payments enjoy a priority payment status from moneys in the General Fund, second only to payments to the public school system and public institutions of higher education. Lease payments that support various lease and appropriation bonds are also considered priority payments but are lower on the list of priorities.
Under California law, GO debt service payments are considered a continuous appropriation, which means they get paid with or without a formal appropriation by the legislature or an enacted budget. Though not as strong, appropriation bonds are also continuously appropriated with prior approval from the Department of Finance, indicating that sufficient funds are available for payment of debt service.
The debt load is large but manageable
The state of California has the nation’s largest amount of tax-supported debt outstanding at $98 billion in 2023 (most recent data available), according to Moody’s. However, on a per capita basis, the state’s debt burden is twelfth highest out of all 50 states at $2,515 versus the Moody’s median of $1,189. On a personal income basis, California was fifteenth highest in the nation, at 3.1% versus the Moody’s median of 2.0%.
Net tax-supported debt in relation to the size of the state’s economy ranked it seventeenth, at 2.5% of state gross domestic product, vs. the Moody’s median of 1.8%. California’s debt ratio is likely to increase over the next few years, as the state has approximately $45.3 billion of GO bonds authorized but unissued and approximately $6.6 billion of authorized and unissued lease revenue bonds as of 01 Jan 2025. Despite the high debt load, total debt service on the state’s bonded debt is manageable and accounts for 3.3% of total governmental funds as of FY23.
State challenges stem from three factors
Many of the state’s fiscal challenges can be directly linked to three main sources: inflexible expenditures, structural governance problems and a volatile and concentrated revenue mix. Previous weakening of California’s credit more than a decade ago was sparked by an economic recession but these inherent risks exacerbated the state’s challenges and limited the state’s ability to react to the weakening revenue.
Inflexible expenditures. The state initiative system often dictates policy and reduces its expenditure flexibility. Many initiatives constrict revenue but increase or maintain expenditures. For example, Proposition 98 calls for approximately 40% of the state’s General Fund to go toward education, and in the process reduces GO debt service from first to second position in priority of payments. In addition, Proposition 13 limits property taxes and effectively shifts local expenses to the state.
Structural governance problems. For years, the state has dealt with structural governance problems such as its highly polarized political environment often causing bipartisan gridlock and budget stalemates. Also, the state requires a two-thirds majority vote of the Legislature to raise taxes. Some progress was made when the state lowered the threshold of approval to pass the budget to just a simple majority. Prior to 2010, a two-thirds majority was required to pass a budget.
A volatile and concentrated revenue mix. Personal income taxes are the largest component of General Fund revenues, accounting for 59% in FY23. California’s income tax rate structure is steep (rates range from 1% to 13.3%), thus a small number of taxpayers pay a large share of tax revenues. The Franchise Tax Board (California’s tax collection agency) indicates that the top 2.4% of California taxpayers paid approximately 50% of total personal income tax in tax year 2022. Therefore, about 29% of the state’s General Fund revenue depends on 2.4% of taxpayers (Figure 1). In addition to having an extremely concentrated revenue mix, the state’s primary tax sources are also highly economically sensitive (Figure 2).
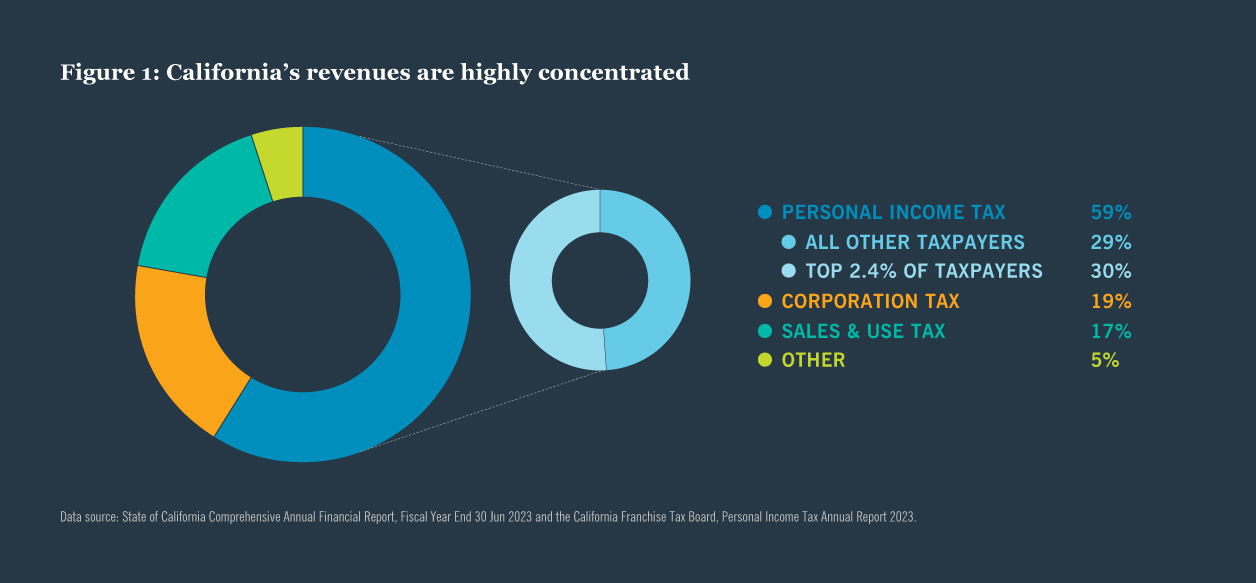
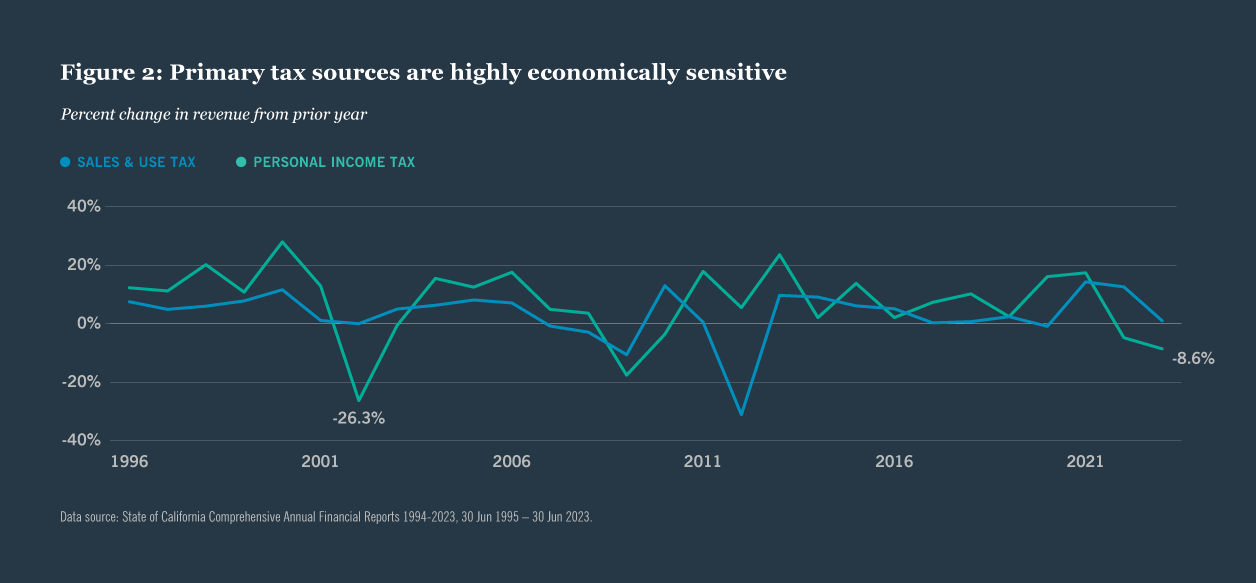
This concentration in an economically sensitive revenue stream means equity market declines can quickly impact the state’s finances. Additionally, sales taxes, another economically sensitive revenue stream, accounted for 17% of General Fund revenues in FY23. These factors have resulted in wide and sudden revenue, financial and credit swings.
A number of credit safeguards are in place
Despite the state’s inherent risks, a number of safeguards ensure timely payment of GO bond debt service:
- GO bonds are secured by the full faith and credit of the fifth largest economy in the world.
- Debt service is a priority payment from the General Fund, second only to support for the public school system and public institutions of higher education.
- The state of California is not authorized to file Chapter 9 bankruptcy and cannot cease to exist.
- GO debt must be approved prior to issuance by the citizens of California in a general election, obligating the citizens for repayment.
- The appropriation to pay debt service on state GO bonds, as set forth in the enabling Bond Acts, cannot be repealed until the principal and interest on the bonds has been fully paid. Debt service on the bonds is a continuous appropriation under the state constitution, meaning there is no need for appropriation from the legislature to pay.
These provisions give bondholders a certain sense of security that debt service will be made.
Looking forward: weathering the challenges
Structural governance changes have helped streamline decisions and improve California’s fiscal position. As a result, the state is better positioned to deal with the challenges presented by any future recession or economic disruption. The state has successfully weathered recessionary challenges historically and is expected to continue to do so going forward.
Related articles


About the author

Contact us

You are on the site for: Financial Professionals and Individual Investors. You can switch to the site for: Institutional Investors or Global Investors
1 The state of California failed to file its annual report for FY24 by the 31 Mar 2025 continuing disclosure deadline. The delay is a result of the state transitioning from several separate legacy accounting systems to a new statewide accounting system. The FY23 report was released 16 Dec 2024 and contains the most recent audited financials available for the state of California, therefore this paper references the FY23 numbers.
Sources
Revenue growth and lower ANPLs boost capacity to manage long-term debt, Moody’s Investors Service, 07 Oct 2024. State of California Franchise Tax Board, Personal Income Annual Reports, 2023, Tax Year 2022. State of California Various Purpose General Obligation Bonds Official Statement, 08 Apr 2025. State of California, Comprehensive Annual Financial Report, Fiscal Year Ended 30 Jun 2023. Bureau of Labor Statistics, Economy at a Glance. Bureau of Economic Analysis.The Bond Buyer. California Department of Finance, Finance Bulletin, July 2025. California State Controller, Monthly State of General Fund Cash Receipts and Disbursements, June 2025 and July 2025. Fast Facts About CalPERS Investment and Pension Funding. California Public Employees’ Retirement System, 2024 Annual Review of Funding Levels and Risks, November 2024. CalSTRS Fast Facts, Fiscal Year Ended 30 Jun 2024. Senate Budget and Fiscal Review Committee, 2025-26 Budget, Key Highlights, 24 Jun 2025. California State Budget 2025-26, Gavin Newsom, Governor, State of California, 27 Jun 2025.
This material is not intended to be a recommendation or investment advice, does not constitute a solicitation to buy, sell or hold a security or an investment strategy, and is not provided in a fiduciary capacity. The information provided does not take into account the specific objectives or circumstances of any particular investor, or suggest any specific course of action. Investment decisions should be made based on an investor’s objectives and circumstances and in consultation with his or her financial professionals.
The views and opinions expressed are for informational and educational purposes only as of the date of production/writing and may change without notice at any time based on numerous factors, such as market or other conditions, legal and regulatory developments, additional risks and uncertainties and may not come to pass. This material may contain “forward-looking” information that is not purely historical in nature. Such information may include, among other things, projections, forecasts, estimates of market returns, and proposed or expected portfolio composition. Any changes to assumptions that may have been made in preparing this material could have a material impact on the information presented herein by way of example. Performance data shown represents past performance and does not predict or guarantee future results. Investing involves risk; principal loss is possible.
All information has been obtained from sources believed to be reliable, but its accuracy is not guaranteed. There is no representation or warranty as to the current accuracy, reliability or completeness of, nor liability for, decisions based on such information and it should not be relied on as such. For term definitions and index descriptions, please access the glossary on nuveen.com. Please note, it is not possible to invest directly in an index.
Important information on risk
Investing involves risk; principal loss is possible. All investments carry a certain degree of risk and there is no assurance that an investment will provide positive performance over any period of time. Investing in municipal bonds involves risks such as interest rate risk, credit risk and market risk. The value of the portfolio will fluctuate based on the value of the underlying securities. There are special risks associated with investments in high yield bonds, hedging activities and the potential use of leverage. Portfolios that include lower rated municipal bonds, commonly referred to as “high yield ”or “junk” bonds, which are considered to be speculative, the credit and investment risk is heightened for the portfolio. Bond insurance guarantee sonly the payment of principal and interest on the bond when due, and not the value of the bonds themselves, which will fluctuate with the bond market and the financial success of the issuer and the insurer. No representation is made as to an insurer’s ability to meet their commitments.
This information should not replace an investor’s consultation with a financial professional regarding their tax situation. Nuveen is not a tax advisor. Investors should contact a tax professional regarding the appropriateness of tax-exempt investments in their portfolio. If sold prior to maturity, municipal securities are subject to gain/losses based on the level of interest rates, market conditions and the credit quality of the issuer. Income may be subject to the alternative minimum tax (AMT) and/or state and local taxes, based on the state of residence. Income from municipal bonds held by a portfolio could be declared taxable because of unfavorable changes in tax laws, adverse interpretations by the Internal Revenue Service or state tax authorities, or noncompliant conduct of a bond issuer. It is important to review your investment objectives, risk tolerance and liquidity needs before choosing an investment style or manager.
Nuveen, LLC provides investment solutions through its investment specialists.
This information does not constitute investment research as defined under MiFID.
Not registered yet? Register
You are about to access our website for visitors outside of the United States.
You are about to access our website for Nuveen Global Cities REIT
You are leaving the Nuveen website.
You are leaving the Nuveen website and going to the website of the MI 529 Advisor Plan, distributed by Nuveen Securities, LLC.The Nuveen website for institutional investors is available for you.
You are about to access our website for visitors outside of the United States.
You are about to access our website for Nuveen DMAT Cart
You are about to access our website for Nuveen Churchill Private Capital Income Fund (“NC - PCAP”)
