Contact us
Contact Nuveen
Thank you for your message. We will contact you shortly.

Key takeaways
- Quarter-to-date returns for municipals are modestly negative due to rising oil prices and heavier supply.
- Longer-dated bonds underperformed the broader municipal market. We continue to favor longer duration municipal bonds over Treasuries.
- We believe a slow start to the quarter provides an attractive entry-point due to higher starting yields and a rewarding shape of the curve.
Muni market recap
Municipal bonds fell last week as elevated issuance and rising oil prices impacted interest rates, causing the municipal market to adjust. While some deals had heavy subscription levels and were well received, other deals were left with lighter subscription levels. Connecticut’s Aquarion Water Authority’s $2.4B bond issuance stood out, drawing roughly $72B of orders after coming out with higher yields than what is typically available in the state. Despite the underperformance, appetite for municipals persisted, as funds and ETFs took in $1.36B, with demand favoring longer-dated investment grade bonds. While demand slowed for high yield two weeks ago, high yield bond flows picked back up this week. We continue to favor longer duration municipals over Treasuries, as we believe the elevated income levels and more favorable ratios offer a compelling opportunity set for investors despite, any volatility from news headlines.
How is supply trending?
Supply topped $15B last week. Certain names did well, but heavier supply and a weaker market tone caused some deals to struggle.
Market impact: A slow start to the quarter for municipals presents an income opportunity for investors as yields have trended higher.
Municipal market returns (%)
| Index returns by maturity | WTD | MTD | YTD |
|---|---|---|---|
| Muni Agg | -0.35% | -0.75% | 1.55% |
| Muni bond 5-year | -0.13% | -0.22% | 0.86% |
| Muni bond 10-year | -0.38% | -0.73% | 0.35% |
| Muni bond 15-year | -0.54% | -1.08% | 1.23% |
| Muni long bond (22+) | -0.48% | -1.19% | 2.77% |
| Muni bond 3-15-year blend | -0.31% | -0.60% | 0.79% |
| Source: Bloomberg L.P., 16 Jul 2026. Performance data shown represents past performance and does not predict or guarantee future results. All index returns are Bloomberg; shown in U.S. dollars. | |||
What do muni yields look like this week?
Municipal yields increased and the long-end underperformed. Elevated yields continue to garner strong demand toward municipals.
| Municipal market yields (%) | Current (%) | Change (bps) | Ratio (%) |
|---|---|---|---|
| 5Y | 2.71 | +8 | 63% |
| 10Y | 3.12 | +9 | 69% |
| 30Y | 4.32 | +5 | 85% |
| Source: MMD, Bloomberg, L.P.; data from 10 Jul 2026–16 Jul 2026. | |||
What are municipal bond flows doing?
Funds and ETFs gathered $1.36B. Demand for high yield increased compared to the prior week, while the long-end continues to see heightened flows.
| OEFs | $617M | ||
| ETFs | $743M | ||
| Long-term funds | $467M | ||
| High yield funds | $265M | ||
| Source: LSEG Lipper, J.P. Morgan data from 09 Jul 2026 – 15 Jul 2026. The summation of OEFs + ETFs represents the total flows. | |||
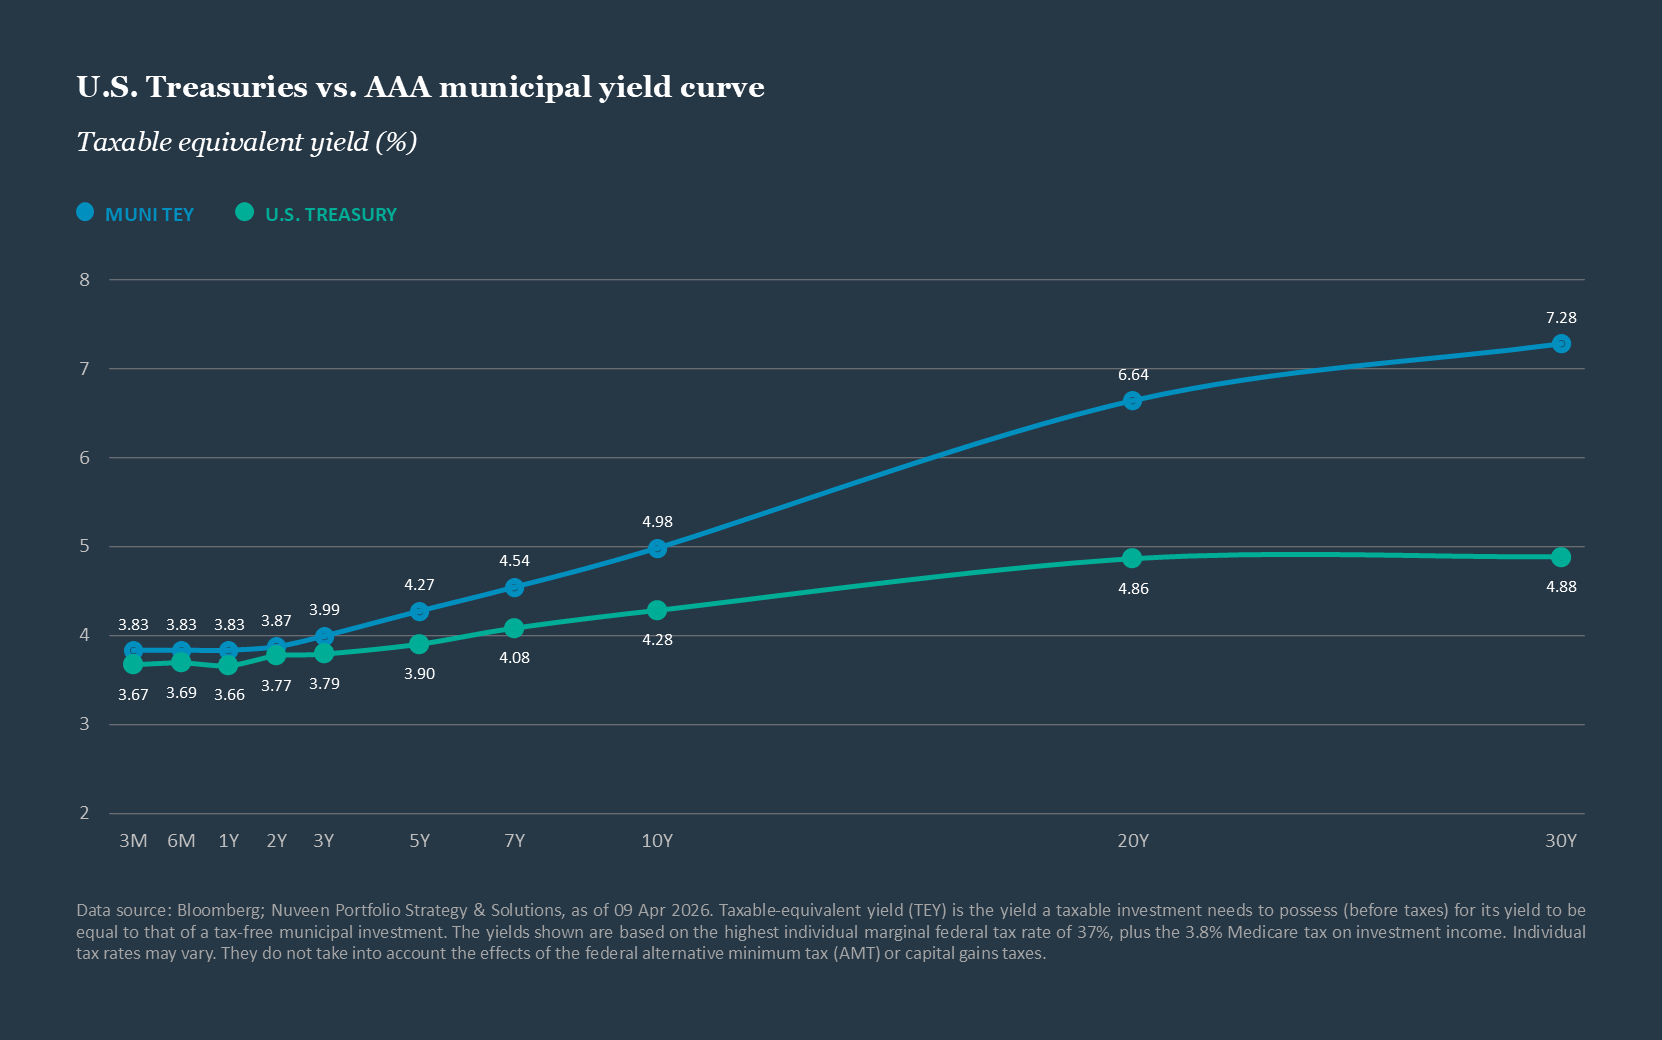
Tax-efficient yields are more attractive in longer-maturity municipals.
Related articles


About the author

Contact us

You are on the site for: Financial Professionals and Individual Investors. You can switch to the site for: Institutional Investors or Global Investors
Endnotes
Sources
Performance: Bloomberg, L.P. Issuance: S&P Ipreo. Fund flows: Lipper and J.P. Morgan. The sum of OEFs and ETFs represent the total municipal flows.
Any reference to credit ratings refers to the highest rating given by one of the following national rating agencies: S&P, Moody’s or Fitch. Credit ratings are subject to change. AAA, AA, A and BBB are investment grade ratings; BB, B, CCC, CC, C and D are below-investment grade ratings.
This material is not intended to be a recommendation or investment advice, does not constitute a solicitation to buy, sell or hold a security or investment strategy, and is not provided in a fiduciary capacity. The information provided does not take into account the specific objectives or circumstances of any particular investor or suggest any specific course of action. Investment decisions should be made based on an investor’s objectives and circumstances and in consultation with his or her advisors.
Representative indexes: Muni bond 5-year: Bloomberg Municipal Bond 5 Year (4–6) Index; Muni bond 10-year: Bloomberg Municipal Bond 10 Year (8–12) Index; Muni bond 15-year: Bloomberg Municipal Bond 15 Year (12–17) Index; Muni long bond: Bloomberg Municipal Long Bond (22+) Index; Muni bond 3–15 year blend: Bloomberg Municipal 3–15 year blend (2–17) Index; Muni AAA: Bloomberg Municipal AAA Index; Muni AA: Bloomberg Municipal AA Index; Muni A: Bloomberg Municipal A Index; Muni BBB: Bloomberg Municipal BBB Index; Muni Agg (1-30) bond: Bloomberg Municipal Bond Index; Muni high yield: Bloomberg High Yield Municipal Index; U.S. aggregate bond: Bloomberg U.S. Aggregate Bond Index; U.S. Treasury: Bloomberg U.S. Treasury Index; U.S. government related: Bloomberg U.S. Government-Related Index; U.S. corporate investment grade: Bloomberg U.S. Corporate Index; U.S. high yield corporate: Bloomberg U.S. Corporate High Yield Index; Taxable municipals: Bloomberg Taxable Municipal Index.
This material, along with any views and opinions expressed within, are presented for informational and educational purposes only as of the date of production/writing and may change without notice at any time based on numerous factors, such as changing market, economic, political, or other conditions, legal and regulatory developments, additional risks and uncertainties and may not come to pass. There is no promise, representation, or warranty (express or implied) as to the past, future, or current accuracy, reliability or completeness of, nor liability for, decisions based on such information, and it should not be relied on as such. This material should not be regarded by the recipients as a substitute for the exercise of their own judgment. It is important to review your investment objectives, risk tolerance and liquidity needs before choosing an investment style or manager.
This material may contain “forward-looking” information that is not purely historical in nature. Such information may include, among other things, projections, forecasts, estimates of yields and/or market returns, and proposed or expected portfolio composition. No representation is made that the performance presented will be achieved, or that every assumption made in achieving, calculating or presenting either the forward-looking information or the historical performance information herein has been considered or stated in preparing this material. Any changes to assumptions that may have been made in preparing this material could have a material impact on any of the data and/or information presented herein by way of example.
For term definitions and index descriptions, please access the glossary on nuveen.com. Please note, it is not possible to invest directly in an index.
Important information on risk
Past performance is no guarantee of future results. All investments carry a certain degree of risk, including the possible loss of principal, and there is no assurance that an investment will provide positive performance over any period of time. Certain products and services may not be available to all entities or persons. There is no guarantee that investment objectives will be achieved.
Investing in fixed income investments involves risks such as market risk, credit risk, interest rate/duration risk, call risk, tax risk, political and economic risk, derivatives risk, and income risk. Credit risk refers to an issuers ability to make interest and principal payments when due. Typically, the value of, and income generated by, fixed income investments will decrease, or increase based on changes in market interest rates. As interest rates rise, bond prices fall and as interest rates fall, bond prices rise. Income is only one component of performance and investors should consider all of the risk factors for an asset class before investing.
Investing in municipal bonds involves risks such as market risk, credit risk, interest rate/duration risk, call risk, tax risk, political and economic risk, derivatives risk, and income risk. Credit risk refers to an ability to make interest and principal payments when due. Typically, the value of, and income generated by, muni bonds will decrease, or increase based on changes in market interest rates. As interest rates rise, bond prices fall and as interest rates fall, bond prices rise. Income is only one component of performance and investors should consider all of the risk factors for an asset class before investing. Income is generally exempt from regular federal income tax and may be subject to state and local taxes, based on the investor’s state of residence, as well as to the federal alternative minimum tax (AMT). Capital gains, if any, are subject to tax. Income from municipal bonds could be declared taxable because of unfavorable changes in tax laws, adverse interpretations by the Internal Revenue Service or state tax authorities, or noncompliant conduct of a bond issuer. Please contact a tax professional regarding the suitability of tax-exempt investments as this information should not replace a client’s consultation with a financial/tax professional regarding their tax situation. Nuveen and its investment specialists do not provide tax advice.
Taxable-equivalent yields are based on the highest individual marginal federal tax rate of 37%, plus the 3.8% Medicare tax on investment income. Individual tax rates may vary.
Nuveen, LLC provides investment solutions through its investment specialists.
This information does not constitute investment research as defined under MiFID.
Not registered yet? Register
You are about to access our website for visitors outside of the United States.
You are about to access our website for Nuveen Global Cities REIT
You are leaving the Nuveen website.
You are leaving the Nuveen website and going to the website of the MI 529 Advisor Plan, distributed by Nuveen Securities, LLC.The Nuveen website for institutional investors is available for you.
You are about to access our website for visitors outside of the United States.
You are about to access our website for Nuveen DMAT Cart
You are about to access our website for Nuveen Churchill Private Capital Income Fund (“NC - PCAP”)
