
TOOLS
Login to access your documents and resources.
Listen to this insight
~ 20 minutes long
New York City stands as America’s largest municipal economy with unmatched commercial depth and financial resilience.1 Strong fiscal governance, diverse revenue streams and conservative budgeting practices provide stability. While facing federal policy uncertainties and demographic shifts, the city maintains robust market access and high-quality credit fundamentals.
Economic scale drives municipal resilience
With a population exceeding 8.4 million — larger than 38 states — New York City’s annual gross city product of $1.2 trillion surpasses 45 states’ economies. The finance sector comprises 24% of gross city product, while growth in technology, life sciences and health care has diversified high and middle-wage employment. The city’s $1.6 trillion property tax base features broad diversification, with top ten taxpayers representing just 10.7% of assessed value.
The Covid pandemic caused a population decline of 450,000 through July 2022, but growth has resumed with 120,000 added through July 2024.
Office vacancy rates of 12.7% remain elevated but are declining, with limited revenue impact since office properties generate less than 6% of tax revenue. Residential real estate growth has offset commercial losses, with assessed value now 13% above pre-pandemic peaks. Forecasted assessed value growth of 4.5%, 2.8% and 2.9% in fiscal years (FY) 2027–2029 demonstrates continued strength in the property tax base that anchors the city’s revenue structure.
Bond issuance demonstrates market leadership
New York City is a frequent issuer of municipal debt. During FY24, New York City and the Transitional Finance Authority (TFA) came to market nine times, issuing $12.6 billion of bonds. According to The Bond Buyer, the city’s bonds comprised nearly 25% of the $52 billion in debt issued by all New York state and local governments and nearly 3% of all municipal debt issued nationally. If New York City were a state, it would rank as the eighth largest municipal debt issuer.
The city’s borrowing pace is expected to continue, with its 10-year capital strategy covering FY26–35 including $169.5 billion of targeted capital commitments. This reliance on municipal markets creates strong incentives to maintain credit quality and market access.
Consistent with safeguarding market access, New York City maintains a diverse debt portfolio of high credit quality. The city’s primary financing vehicles are general obligation bonds (GO; rated Aa2/AA/AA by Moody’s/S&P/Fitch) and Future Tax Secured bonds (FTS; rated Aa1/AAA/AAA), representing 40% and 48% of total outstanding debt, respectively, in FY24.
The city comptroller and mayor jointly approve debt issuance. While voter approval is not required for GO or TFA FTS bonds, statutory limits apply. The New York State Constitution limits GO debt to 10% of the most recent five-year average of taxable real estate. The recently amended Transitional Finance Authority Act permits $30.5 billion of outstanding FTS bonds and additional FTS debt, provided additional indebtedness stays within constitutional limits.
The city had $41.7 billion of GO debt and $49.9 billion of TFA debt outstanding as of 30 June 2024, with capacity for another $41 billion before reaching statutory limits (Figure 1).

Bonds offer strong security features
New York City’s debt attracts investors through robust security mechanisms. GO bonds are backed by the city’s full faith and credit, payable from unlimited property tax revenues. Under the 1975 Financial Emergency Act, property taxes flow directly into the General Debt Service Fund, administered by the state comptroller, ensuring debt service payment before any revenue release to the city.
TFA bond security structure: TFA FTS bonds hold subordinate liens on city resident personal income tax, with sales taxes as backup if coverage falls below 1.5x debt service (never required). In 2024, pledged revenues provided strong 7.28x coverage.
Revenue collection and flow: The state collects both revenue streams and forwards them to the state comptroller. PIT revenues flow monthly to the bond trustee, who reserves debt service funds before releasing excess to the city.
Rate setting protection: Any changes in income or sales tax rates require New York State legislative action and gubernatorial approval, providing additional revenue stability for bondholders.
Crisis response created governance strength
New York City’s financial framework was transformed by the 1970s fiscal crisis when the state created a Financial Control Board with permanent oversight powers. This crisis-born governance structure mandates:
- Balanced budgets: The city must adopt a balanced budget and end each year without a deficit.
- Long-term financial planning: The city must prepare a four-year financial plan, updated quarterly. The plan must remain balanced for the current fiscal year, and the following fiscal year must be balanced by January.
- Limits on short-term debt: Short-term debt is limited to 90% of available taxes or revenues designated to repay the debt and must mature within the fiscal year.
- Timely annual audits: The city’s annual audit must be completed within four months of the fiscal year-end in accordance with generally accepted auditing standards.
The Board successfully restored fiscal balance by 1986 and continues quarterly monitoring today, with authority to reimpose controls if needed.
Credit quality withstands economic shocks
New York City has maintained general fund surpluses before discretionary transfers every year since 1981, demonstrating remarkable resilience through major crises including 9/11, the Great Recession and the Covid pandemic. This consistent performance reflects strong fiscal oversight, conservative budgeting and economic depth.
The Covid pandemic brought steep revenue declines and emergency expenditures, yet federal relief funds and proactive financial planning preserved strong credit quality. For over 25 years, the city has maintained mid-to-high investment grade ratings, demonstrating its ability to withstand economic disruptions and adapt fiscal strategies to safeguard long-term stability (Figure 2).

Conservative budgeting supports performance
New York City maintains fiscal strength through conservative revenue projections. The city typically forecasts sizable deficits in latter financial plan years, which are eliminated as expenditures are controlled and revenues exceed projections. According to the Fiscal Policy Institute, from 2014 to 2023, the city’s financial plans projected average budget gaps of 6.1%, while revenues exceeded projections by an average of 6.4%.
These conservative forecasts provide the foundation for the Mayor’s Office of Management and Budget to control spending through its Program to Eliminate the Gap (PEG). Recent 5% departmental cuts due to asylum seeker costs were partially restored as revenues outperformed and costs declined, demonstrating budgeting effectiveness.
Performance stability maintains reserves
New York City has historically maintained thinner reserves, but these have remained steady due to stable financial performance. The city’s total general fund balance was $4.0 billion in FY24, or 3.6% of general fund revenue, consistent with reserve levels over the last five years. Including fund balances in general debt service and nonmajor debt service funds, reserves increase to $8.5 billion, or 7.5% of general fund revenue.
New York City established a Revenue Stabilization Fund in FY21 categorized as “committed” within the general fund balance. The city maintained $2 billion, or 1.8% of general fund revenue, in the Rainy Day fund at FY24 close, with these reserves expected to remain stable through FY25 and FY26. No more than 50% of the fund may be withdrawn annually unless the mayor certifies compelling fiscal need.
The city’s adopted $112.4 billion FY25 budget increased 5% from the prior year, accounting for labor costs, inflation and asylum seeker support. Revenues were revised upward multiple times due to stronger economic growth, while expenditures increased less, resulting in an expected $3.8 billion surplus. Following city practice, this surplus will pre-pay FY26 debt service.
The city council adopted its $115.9 billion fiscal 2026 budget in June 2025, which is balanced including pre-payments from fiscal 2025. Expenditures are only $3.5 billion (3%) higher than original fiscal 2025 levels and $4.9 billion (4%) lower than revised year-end estimates.
Projected outyear gaps of $5.0 billion (4.1%), $6.1 billion (4.8%) and $6.0 billion (4.6%) for fiscals 2027–2029 align with prior financial plans, which the city’s OMB has effectively closed historically.
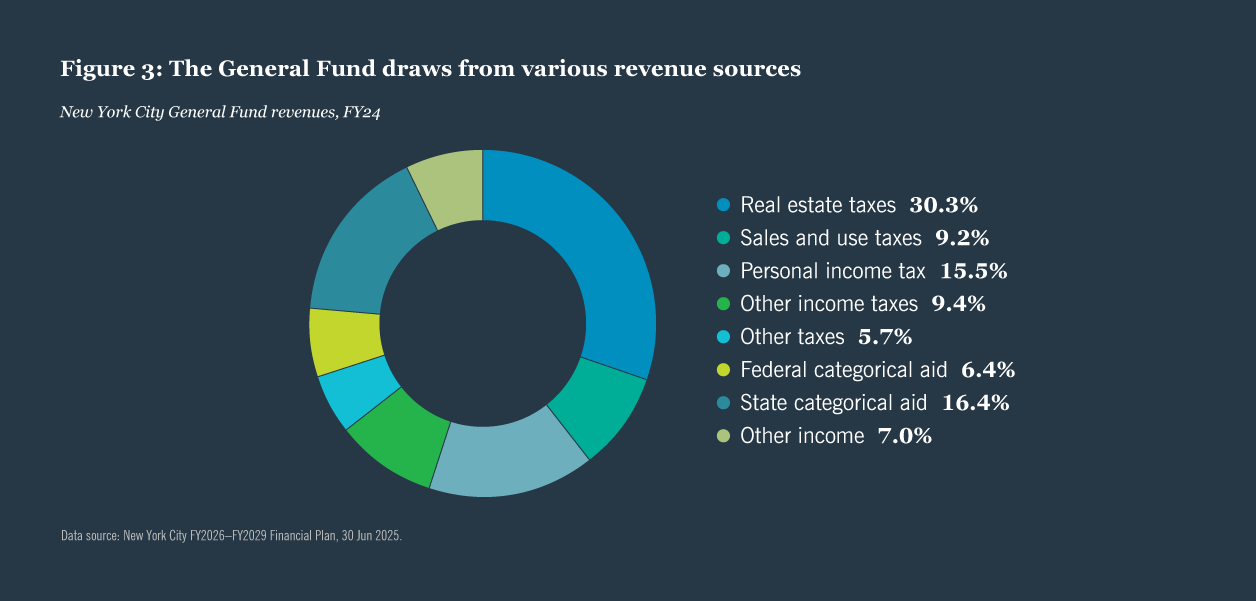
Revenue diversity supports stability
New York City’s general fund draws from a diverse revenue portfolio consisting of property taxes (30%), personal income and pass-through-entity taxes (15%), corporate income taxes (9%) and sales taxes (9%). The city also relies on state categorical grants (16%) and federal aid (6%) (Figure 3). This revenue diversity provides fiscal insulation against declines in any single revenue stream.
Property tax assessment limits (6% annual increases for single-family homes, five-year phase-ins for commercial properties) enhance revenue stability by smoothing valuation changes. Notably, New York State’s property tax cap excludes New York City, allowing rate increases through city council votes.
The city’s personal and corporate income taxes require the state legislature to authorize rate adjustments. The city’s personal income tax features four brackets compared to the state’s nine, with the highest rate of 3.876% applying to taxable income above $50,001 for single filers. This contrasts with the state’s top rate of 10.9% on income exceeding $25 million. City residents pay this tax in addition to state income tax.
Even with a tax structure that does not heavily target top earners, the city relies on high-income taxpayers and Wall Street bonuses. According to the NYC Independent Budget Office, the top 1% of income tax filers comprised 36% of income tax liability in 2022, rising to 44% in 2021 when Wall Street bonuses reached record highs.
In 2023, financial activities represented 10.9% of city employment but 25.1% of resident earnings and 24% of gross city product — significantly above national averages of 4.5%, 9.6% and 7.3%, respectively.
New York City levies a 4.5% sales tax, which consumers pay alongside New York State’s 4% sales and use tax and the Metropolitan Commuter Transportation District’s 0.375% surcharge, totaling 8.875%. Like with income taxes, the state authorizes the city’s sales tax, requiring state legislative approval for rate adjustments, and providing additional revenue stability through this governance structure.
Debt obligations exceed peer levels
New York City’s debt burden is high compared to most municipalities. Total outstanding tax-supported debt, including TFA FTS bonds and lease obligations, reached $116 billion at FY24 close, equivalent to 7.9% of full value and $14,092 per capita. However, this higher burden partially reflects the city’s unusually broad service scope — it provides services typically handled by three separate governments: county, city and school district.
Debt relative to budget provides a better burden measurement. At fiscal 2024 close, tax-supported debt equaled 95% of total governmental fund revenues, with debt service comprising 10.6% of city tax revenues — more moderate levels. Variable rate debt represents 7.2% of obligations, with average repayment schedules (50% of GO debt and 42% of TFA debt mature within ten years).
New York City participates in five well-funded pension plans with an 85.5% combined funded ratio, exceeding the 80% median for U.S. local government pensions in 2024. Consistent actuarially determined contributions have supported strong funding levels.
However, New York City faces long-term financial pressure from $98 billion in other post-employment benefits (OPEB) liabilities. The city maintains only $5 billion in OPEB trust funds — sufficient for less than two years of payments — requiring a pay-as-you-go funding approach. Recent court decisions have complicated cost-containment efforts, blocking both a transition to Medicare Advantage plans that would have saved $600 million annually and the elimination of one OPEB plan option, though the latter ruling is under appeal to the Court of Appeals.
New York City’s debt burden is high, but it provides services typically handled by three separate governments: county, city and school district.
Policy changes create future challenges
The primary near-term risk to New York City’s financial health is an economic downturn, but conservative budgeting has mitigated much of this risk. The city forecasted modest 1.2% tax revenue growth in fiscal 2026, positioning for outperformance that could assist in pre-funding fiscal 2027 expenditures if economic conditions remain stable. Long-term housing affordability poses additional risks by potentially deterring in-migration and accelerating out-migration as residents seek more affordable alternatives.
Recent federal Medicaid and SNAP changes (effective January 2027) create challenges through increased state costs that may reduce NYC aid, new administrative costs for work requirement verification, and higher demand for city services from reduced federal benefits.
The federal government has identified New York City among cities potentially facing aid reductions or federal intervention. The city’s sanctuary policies conflict with federal immigration enforcement priorities, while the Department of Transportation opposes congestion pricing and has threatened to withhold federal grant funding. A court order currently prevents federal fund withholding during ongoing litigation.
Despite these headwinds, New York City remains well-positioned to withstand potential federal cuts, as federal categorical grants comprise just 6.4% of the city’s fiscal 2026 budget. The city’s diversified revenue base, conservative budgeting practices and strong fiscal governance framework provide substantial insulation against federal policy changes and economic volatility.
Economic strengths sustain stability
Despite federal policy headwinds and economic uncertainties, New York City’s fundamental strengths — unrivaled economic scale, global financial center status and proven fiscal framework — position it for continued stability.
Through the fiscal oversight framework established under the Financial Emergency Act, the city has demonstrated strong financial management across multiple economic cycles and a consistent track record of maintaining investment-grade ratings during major crises — including 9/11, the Great Recession and the pandemic. This history provides confidence in the city’s ability to navigate future challenges.
The city’s conservative budgeting practices, diversified revenue portfolio and substantial remaining debt capacity of $41 billion create fiscal flexibility to address emerging pressures. This, combined with the strong incentive to maintain market access as one of the nation’s largest municipal bond issuers, makes New York City well-positioned to preserve its financial stability while adapting to evolving economic and policy conditions.

Find out what is driving opportunities for taxable municipal bonds as we near the tail end of 2025.

A deeper narrative is emerging – one of resilience, strategic opportunity and potential reward for forward-thinking investors.

New York State has a wide array of tools at its disposal to adapt and to maintain financial stability.


Endnotes
Sources
1 Bureau of Economic Analysis: 2023 County and MSA gross domestic product (GDP) summary
City of New York. Debt Management Policy New York City General Obligation and New York City Transitional Finance Authority. September 2024; NYC Investor Relations Site. Debt
Management Policy; New York City Comptroller, Annual Report of Capital Debt and Obligations, Fiscal Year 2025; New York City Comptroller, “A Strong Fiscal Framework for New York
City, Proposals to Improve the City’s Financial Management and Promote Fiscal Responsibility,” June 2024; McMahon, E.J. Manhattan Institute. “Taking Control: How the State Can
Guide New York City’s Post-Pandemic Fiscal Recovery,” 24 Sep 2020; New York City Comptroller, “Debt Affordability Study,” 29 Feb 2024; Center for New York City Affairs, “City
Limits: What is New York’s Mayor Really Able to Do? A Q&A with Author Lynne A. Weikart,” 12 May 2021; The City of New York, New York. “Annual Comprehensive Financial Report
of the Comptroller for the Fiscal Years Ended 30 Jun 2024 and 2023,” 30 Oct 2024; New York City Transitional Finance Authority. “Financial Statements (Together with Independent
Auditors’ Report) 20 Jun 2024 and 2023,” 3 Oct 2024; Perry, Andrew. Fiscal Policy Institute. Low Expectations: Understanding the NYC Budget Gap. May 2023; New York City
Independent Budget Office. “Highlights from IBO’s Updated Tables on New York City Residents’ Income & Income Tax Liability in 2022.” December 2024; New York State Comptroller.
“Where New Yorkers Work: An Analysis of Industries and Occupation in New York.” October 2024; New York City Comptroller. “New York by the Numbers Monthly Economic and Fiscal
Outlook.” No. 105 – September 2025; New York City Economic Development Corporation. State of the New York City Economy 2024; Moody’s Commercial Real Estate. “Higher-forLonger: New York Office Vacancy Rates.” 19 May 2025; NYC Department of City Planning, Population Division. “New York city’s Population Estimates and Trends.” May 2025 Release;
S&P Global Ratings. “U.S. Local Government Pension Funding Improved In Fiscal 2024, Helping To Buoy Credit Ratings.” 16 Sept 2025.
This material is not intended to be a recommendation or investment advice, does not constitute a solicitation to buy, sell or hold a security or an investment strategy, and is not provided in a fiduciary capacity. The information provided does not take into account the specific objectives or circumstances of any particular investor, or suggest any specific course of action. Investment decisions should be made based on an investor’s objectives and circumstances and in consultation with his or her financial professionals.
The views and opinions expressed are for informational and educational purposes only as of the date of production/writing and may change without notice at any time based on numerous factors, such as market or other conditions, legal and regulatory developments, additional risks and uncertainties and may not come to pass. This material may contain “forward-looking” information that is not purely historical in nature. Such information may include, among other things, projections, forecasts, estimates of market returns, and proposed or expected portfolio composition. Any changes to assumptions that may have been made in preparing this material could have a material impact on the information presented herein by way of example. Performance data shown represents past performance and does not predict or guarantee future results. Investing involves risk; principal loss is possible.
All information has been obtained from sources believed to be reliable, but its accuracy is not guaranteed. There is no representation or warranty as to the current accuracy, reliability or completeness of, nor liability for, decisions based on such information and it should not be relied on as such. For term definitions and index descriptions, please access the glossary on nuveen.com. Please note, it is not possible to invest directly in an index.
Important information on risk
Investing involves risk; principal loss is possible. All investments carry a certain degree of risk and there is no assurance that an investment will provide positive performance over any period of time. Investing in municipal bonds involves risks such as interest rate risk, credit risk and market risk. The value of the portfolio will fluctuate based on the value of the underlying securities. There are special risks associated with investments in high yield bonds, hedging activities and the potential use of leverage. Portfolios that include lower rated municipal bonds, commonly referred to as “high yield” or “junk” bonds, which are considered to be speculative, the credit and investment risk is heightened for the portfolio. Bond insurance guarantees only the payment of principal and interest on the bond when due, and not the value of the bonds themselves, which will fluctuate with the bond market and the financial success of the issuer and the insurer. No representation is made as to an insurer’s ability to meet their commitments.
This information should not replace an investor’s consultation with a financial professional regarding their tax situation. Nuveen is not a tax advisor. Investors should contact a tax professional regarding the appropriateness of tax-exempt investments in their portfolio. If sold prior to maturity, municipal securities are subject to gain/losses based on the level of interest rates, market conditions and the credit quality of the issuer. Income may be subject to the alternative minimum tax (AMT) and/or state and local taxes, based on the state of residence. Income from municipal bonds held by a portfolio could be declared taxable because of unfavorable changes in tax laws, adverse interpretations by the Internal Revenue Service or state tax authorities, or noncompliant conduct of a bond issuer. It is important to review your investment objectives, risk tolerance and liquidity needs before choosing an investment style or manager.
Nuveen, LLC provides investment solutions through its investment specialists.
This information does not constitute investment research as defined under MiFID

