
In 2009, California had no reserves, issued IOUs and faced a multi-billion-dollar deficit. Today the state enters FY2027 with a budgeted $35.2 billion in reserves, equal to 12.3% of General Fund revenues. Three voter-approved constitutional reforms drove this shift, giving investors a fundamentally stronger credit story.
Key takeaways
- California rebuilt its fiscal foundation through constitutional reforms, growing reserves from zero to $35.2 billion since 2009.
- Stronger budget rules and priority payment protections support bondholder confidence, even amid revenue concentration risk.
- Heavy reliance on personal income taxes tied to equity markets leaves the state exposed to future downturns.
A stronger foundation earns stronger ratings
Three constitutional guardrails, approved by voters, now anchor the state’s fiscal governance and mark a lasting shift from the crisis years of 2009. Rating agencies have taken notice: Moody’s rates California Aa2, S&P assigns AA- and Fitch rates it AA, all with stable outlooks – the strongest ratings in the state’s modern history.
The upgrades reflect real structural progress. California has repaid billions in budgetary borrowings, paid down retiree health obligations and begun prefunding pensions, leaving it better prepared for a slowing economy than at any point in recent history. For municipal bond investors, we think the state now has real capacity to manage headwinds ahead.
Voter-approved reforms rebuilt fiscal discipline
Beyond general economic recovery, three institutional changes strengthened California’s credit profile:
Proposition 25 (2010) cut the legislature’s budget-passage threshold from a two-thirds supermajority to a simple majority and docks lawmaker pay for late budgets, incentivizing on-time passage.
Proposition 2 (2014) strengthened California’s Rainy Day Fund to mitigate revenue volatility. It requires annual deposits equal to 1.5% of General Fund revenues and captures a portion of capital gains tax revenue above 8% of General Fund tax receipts. Through FY2030, these funds support both reserve building and paying down pension and retiree health liabilities.
Propositions 30 and 55 raised taxes on top earners. Proposition 30 (2012) temporarily raised sales taxes by 0.25% to 7.5% from January 2013 through December 2016, and raised personal income taxes by 3% to 13.3% for the top bracket from 2012 through 2018. Proposition 55 (2016) extended the personal income tax increase for 12 additional years, through 2030. Voters will decide whether to make it permanent via Proposition 3 in November 2026.
These reforms helped the state pass budgets on time for 15 years while paying down debt and building reserves. Since the Great Recession, California has used economic recovery to prepare for the next downturn.
Total reserves under Proposition 2 grew from zero in 2009 to a projected $35.2 billion for FY2027 – the constitutional maximum of 10% of General Fund revenues. These actions earned 2019 rating upgrades: Aa2 from Moody’s, AA- from S&P and AA from Fitch.
Cash management tools stand ready
Beyond balanced-budget measures, California has tools to manage cash flow disruptions. The state can borrow from $69 billion in internal funds, as projected in the 2026-27 Governor’s Budget, or issue revenue anticipation notes (RANs) or warrants (RAWs) if needed.
RANs typically bridge the gap between revenue collection and bill payment; RAWs are issued only when no budget is in place and were last used in the early 2000s. California hasn’t issued RANs since FY15, with none planned through FY26-27 – a sign of improved financial health given the state’s historical reliance on them.
If needed, the state could issue IOUs, as it did in 2009. However, Proposition 58 (2004) now bars long-term debt to fund operating deficits.
FY2027 budget rests on strong revenue and rising reserves
Revenue strength shapes the FY2027 budget
California’s financial position stayed strong in FY2025 despite budget pressures. General Fund tax revenues rose 13.4% year-over-year on strong personal income tax and capital gains collections, while reserves ended the year at $57.8 billion, or 26.1% of General Fund revenues. Despite a net deficit after transfers, reserve levels and revenue growth showed considerable flexibility.
The fiscal outlook improved further in FY2026 as capital gains-driven tax collections beat expectations, prompting upward revenue revisions and a stronger starting point for the FY2027 budget – even as structural imbalance and Medi-Cal funding uncertainty persisted.
The FY2027 budget closes a projected gap
Building on this momentum, California enacted a $351.7 billion FY2027 budget that closed a previously projected deficit through stronger revenue and new revenue measures. General Fund spending totals $251.1 billion, reflecting continued Medi-Cal pressure alongside investments in education, housing and reducing homelessness.
The budget includes a $3.6 billion Rainy Day Fund deposit and a new $6.4 billion Surplus Temporary Holding Account, bringing total reserves to $35.2 billion, or 12.3% of General Fund revenues. The holding account returns to the General Fund in FY2028, adding one-time flexibility as the state manages future pressures.
While the budget adds healthcare revenues and delays some Medi-Cal reductions, it largely defers major responses to federal Medicaid cuts. The budget is projected to stay balanced through FY2028, though the Legislative Analyst’s Office continues to flag out-year structural deficits and federal funding uncertainty.
A November ballot measure could expand reserves
In a potentially credit-positive move, voters will consider Proposition 2 in November 2026. The amendment would raise the Rainy Day Fund cap from 10% to 20% of General Fund revenues, exempt reserve deposits from the Gann Limit and extend the state’s debt repayment period through 2040.
The Gann Limit is a constitutional spending cap tied to population and income growth that forces excess revenue back to taxpayers and schools; exempting reserves from it would make it easier for the state to save during strong years.
Tax measures on the ballot warrant monitoring
Voters will also weigh tax measures with manageable credit implications. Proposition 3 would make high-income tax rates permanent, while Propositions 40, 41 and 42 compete over a proposed one-time wealth tax on roughly 200 billionaires. If all three pass, only the measure with the most votes takes effect.
These proposals warrant monitoring, but face procedural and legal hurdles, and even a worst-case taxpayer relocation scenario looks modest against California’s broad income tax base.
Recent cash flow trends confirm resilience
Per the state controller’s fiscal year-to-date June 2026 State Cash Report, total General Fund revenues came in $913 million, or 0.4%, ahead of the May Revision and $25.7 billion, or 11%, above the same period in 2025. All three largest tax categories outperformed: personal income tax rose 21.6%, corporate income tax 21% and sales tax 4%. Expenditures ran $10 billion, or 4.0%, below budget.
Such swings aren’t unusual given the state’s reliance on income taxes tied to the stock market, underscoring the value of recent reserve policy reforms. Preliminary July 2026 figures show revenues 1.5% above budget estimates and spending 11.5% below.
Pension funding keeps improving
California has made real progress addressing unfunded pension liabilities across its two retirement systems: CalPERS and CalSTRS.
The 2012 Public Employees’ Pension Reform Act (PEPRA) ended contribution holidays and retroactive benefit increases, barred purchasing extra years of service toward retirement benefits, raised employee contributions, lowered benefit formulas and capped compensation for CalPERS members. A 2014 law aims to eliminate the CalSTRS unfunded liability by 2046 through rising annual contributions.
The state has also made supplemental payments to both systems during strong years. CalPERS’ funded ratio reached a preliminary 79% for FY25, up from 75%; CalSTRS reached 77% for FY24, up from 76%.
Under current assumptions, supplemental payments should keep the state’s contribution rate stable through FY2028, with full funding of the state’s unfunded obligation projected by FY2029.
Total fixed costs – debt service, pension and retiree healthcare contributions – fell to 5.96% of governmental fund expenditures in FY25, down from 7.5% in FY22. That’s higher than New York’s 3.3% but well below New Jersey’s 12.5%, Connecticut’s 23.4% and Illinois’ 14.5%.
A large, diverse economy underpins the state
California’s $3.39 trillion economy is the nation’s largest, accounting for nearly 14% of U.S. GDP. Standalone, it would rank as the world’s fourth largest economy, per the IMF. Real GDP grew 2.5% in 2025, outpacing the nation’s 2.1%.
The economy is diverse, with strength across tech, trade, entertainment, manufacturing and tourism, generally mirroring the national mix. Still, unemployment stood at 5.2% in June 2026, above the national 4.1%, driven by slower and less diversified job growth concentrated in healthcare and education.
Housing affordability, federal trade and immigration policy and broader uncertainty have also softened the labor market. The tech sector remains a key growth driver, but its tie to equity markets creates fiscal sensitivity.
The AI boom cuts both ways for revenue
AI-driven growth reinforces both California’s economic strength and its revenue volatility. Like in the dot-com era, tech wealth, stock compensation and capital gains can quickly convert equity gains into tax receipts – a strength in expansions but a risk in corrections, since personal income taxes dominate General Fund revenue and are mostly paid by high earners.
The key difference from the dot-com era is that California now has a stronger fiscal framework. Proposition 2 requires reserve deposits tied to capital gains thresholds, Proposition 25 reduces gridlock risk and Proposition 58 bans long-term deficit financing. These safeguards don’t eliminate exposure to a tech-led downturn, but they leave the state far better positioned than in the early 2000s.
California leads the nation in muni issuance
California is the largest municipal debt issuer among all states, with $83.6 billion issued in 2025 – 14.4% of national issuance, per The Bond Buyer.
The state issues two types of debt: general obligation (GO) and annual appropriation (lease revenue) bonds. GO bonds are rated Aa2 by Moody’s, AA- by S&P and AA by Fitch. Unlike appropriation debt, GO bonds must be approved by voters in a general election before issuance. GO debt service holds priority status from the General Fund, second only to public education funding; appropriation bonds also carry priority status, though lower.
Under state law, GO debt service is a continuous appropriation, paid regardless of legislative action or an enacted budget. Appropriation bonds carry similar, though slightly weaker, protection, with Department of Finance approval confirming funds are available.
Debt load is large but well-managed
California carries the nation’s largest tax-supported debt at $101.1 billion in 2024, per Moody’s. On a per capita basis, though, its debt burden ranks twelfth among states at $2,563, versus the Moody’s median of $1,214. Relative to state GDP, it ranks seventeenth at 2.5%, versus a 1.7% median.
Debt is likely to grow, with $41.3 billion in authorized but unissued GO bonds and $5.4 billion in authorized lease revenue bonds as of January 2026. Still, total debt service remains manageable at 2.6% of governmental funds in FY25.
Three factors drive the state’s fiscal risk
California’s fiscal challenges trace to three sources: inflexible expenditures, structural governance issues and a volatile, concentrated revenue mix. A prior credit downturn over a decade ago stemmed from recession, but these structural risks limited the state’s ability to respond.
Inflexible expenditures. Ballot initiatives often dictate spending and limit flexibility. Proposition 98 directs roughly 40% of the General Fund to education, pushing GO debt service to second priority. Proposition 13 caps property taxes, shifting costs to the state.
Structural governance problems. Political polarization has long caused gridlock and stalemates, and tax increases still require a two-thirds legislative vote. Lowering the budget-passage threshold to a simple majority in 2010 marked real progress.
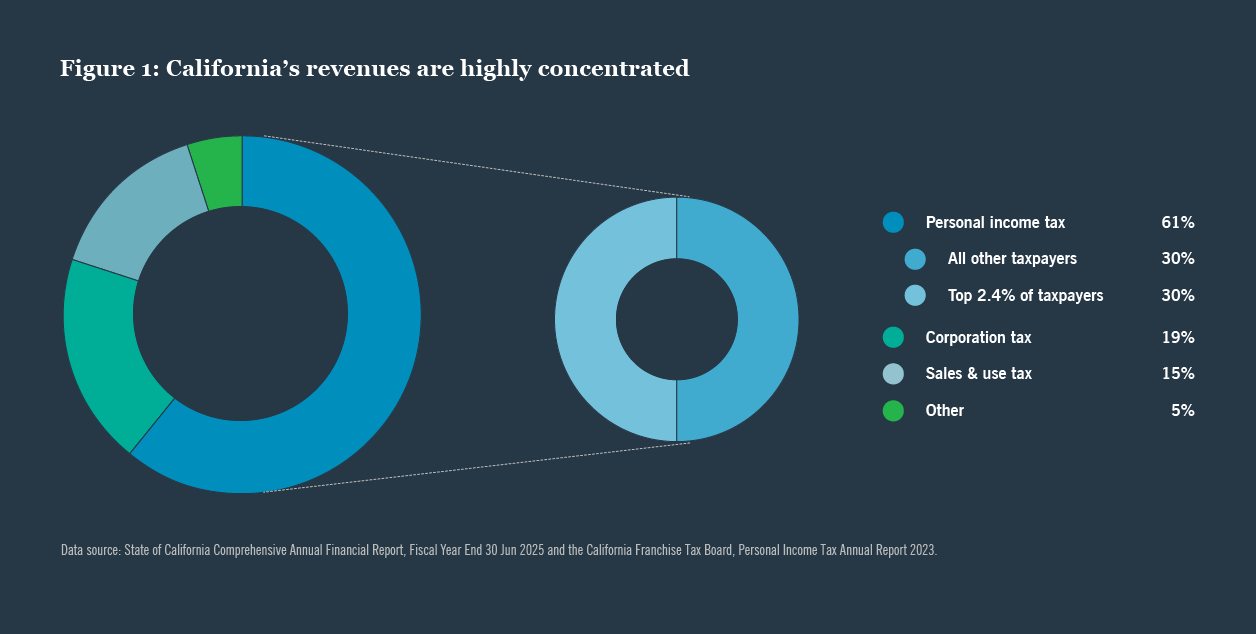
Concentrated, volatile revenue. Personal income taxes made up 60.6% of General Fund revenue in FY25. With rates from 1% to 13.3%, a small share of taxpayers pays most of the bill: the top 2.4% paid roughly 50% of personal income tax in 2022, meaning about 30% of General Fund revenue depends on a sliver of filers (Figure 1).
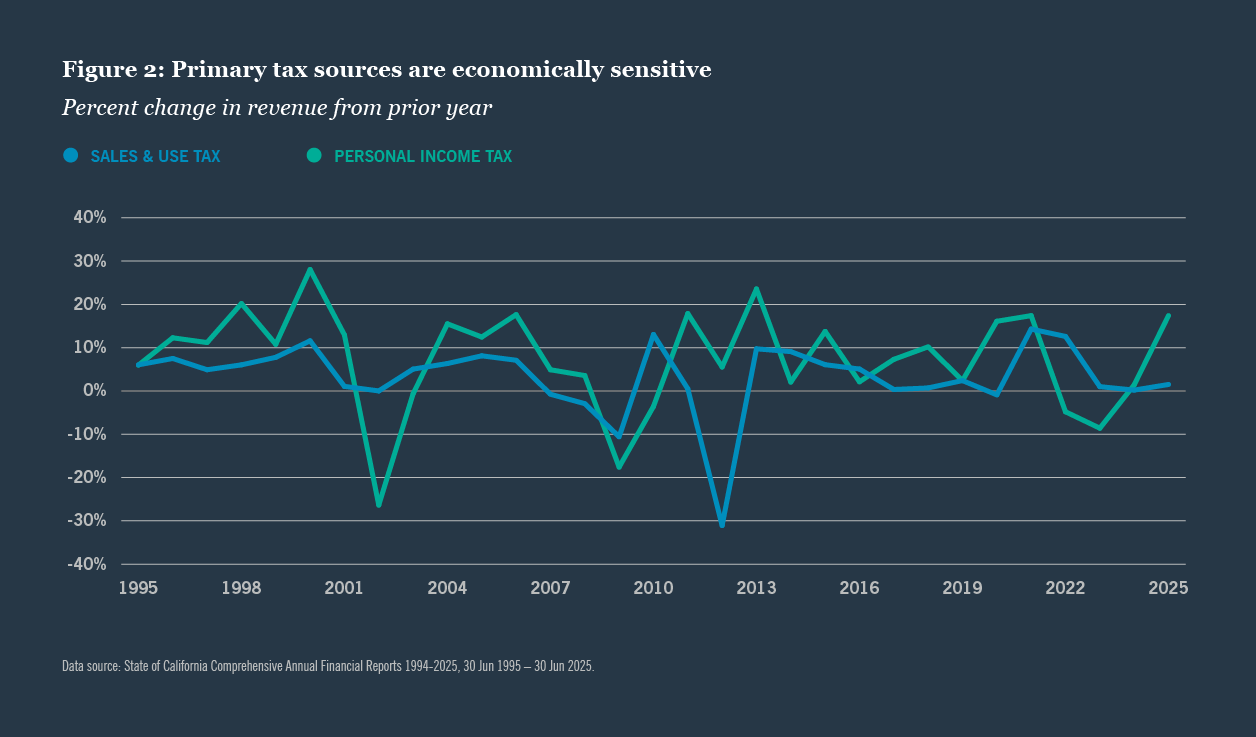
This concentration, paired with high economic sensitivity in the state’s top revenue sources (Figure 2), means equity market swings can move state finances quickly. Sales tax, another economically sensitive source, made up 15% of FY25 revenue. Together, these dynamics drive sharp revenue and credit swings.
Bondholder safeguards remain firmly in place
Despite these risks, several safeguards protect timely GO debt service:
- GO bonds carry the full faith and credit of the world’s fourth largest economy.
- Debt service ranks as a priority General Fund payment, second only to public education.
- California cannot file for Chapter 9 bankruptcy.
- GO debt requires voter approval before issuance, obligating citizens to repayment.
- Appropriations for GO debt service cannot be repealed until bonds are fully repaid, and payment is a continuous constitutional appropriation requiring no legislative action.
Together, these provisions offer bondholders meaningful added protection.
A stronger position for the road ahead
Structural governance reforms have streamlined decisions and strengthened California’s fiscal position, leaving the state better equipped for future recessions or disruptions. California has weathered downturns before and is well-positioned to do so again.
For municipal bond investors, larger reserves, stronger budget rules and priority payment protections support credit stability, though income tax concentration and policy uncertainty merit continued monitoring.
About the author

Related articles

Fixed income perspective: preferred securities

The energy transition: 10 essential indicators for institutional investors

Contact us









- +1 312 917 7700
- 333 W Wacker Drive, Chicago, United States of America
State of California Controller Statement of General Fund Cash Receipts and Disbursements, June 2025 and July 2026.
State of California Federally Taxable Various Purpose General Obligation Bonds Official Statement, April 8, 2026.
State of California Comprehensive Annual Financial Report, Fiscal year ended 30, June 2025.
State Pension liabilities continue to decline, improving leverage metrics, Moody’s Investors Service, 19 September 2025.
State of California Franchise Tax Board, Personal Income Annual Reports, 2023, Tax Year 2022.
Bureau of Labor Statistics, Economy at a Glance.
Bureau of Economic Analysis.
The Bond Buyer.
California Department of Finance, Finance Bulletin, July 2026.
California State Controller, Monthly State of General Fund Cash Receipts and Disbursements, June 2026 and July 2026.
CalSTRS Fast Facts, Fiscal Year Ended 30 Jun 2025.
CalPERS Facts at a Glance, FY2024-25 Funding.
Senate Budget and Fiscal Review Committee, 2026-27 Budget, Key Highlights, 26 Jun 2026.
California State Budget 2026-27, Gavin Newsom, Governor, State of California, 26 Jun 2026.
State of California Employment Development Department, Industry Employment.
Legislative Analyst Office, 2025 Update: Tech Company Stock Pay Accounts for One-Quarter of Withholding Growth So Far in 2025-26, December 3, 2025. 2025 Update: Tech Company Stock Pay Accounts for One-Quarter of Withholding Growth So Far in 2025-26 [EconTax Blog].
Governor’s Budget Summary 2025-26, Gavin Newsom, Governor, State of California, January 10, 2025 Budget Summary.
Governor’s Budget Summary 2026-27, Gavin Newsom, Governor, State of California, January 9, 2026 2026-27 GB Budget Summary.
The 2026-27 Budget: California’s Fiscal Outlook, Legislative Analyst Office, Gabriel Petek, Legislative Analyst, November 2025 2026-27_Fiscal_Outlook_111925.pdf
State of California Annual Comprehensive Financial Reports
Legislative Analyst Office, Initiative Analysis on AG 25-0034, Amendment #1, 11 Dec 2025.
“California’s Amended Wealth Tax Initiative Meets Five New Foes,” Pillsbury Law SeeSALT Blog, Carley Roberts, Robert P. Merten III, Jeff Phang, and Annie Rothschild, 15 Dec 2025.
Morgan Stanley Podcast, Municipal Strategies: California’s Billionaires’ Tax, Mark T. Schmidt, CFA, 12 Jan 2026.
“Billionaire tax, affordable housing: See the measures on California’s November ballot,” CalMatters. org, 30 Jun 2026.
Legislative Analyst Office, Initiative Analysis on AG 2025-0024, Amendment #1, 11 Dec 2025.
“Ballot measures and new laws reshape state tax policy,” Nuveen MuniNotes, Aug 2026.
This material is not intended to be a recommendation or investment advice, does not constitute a solicitation to buy, sell or hold a security or an investment strategy, and is not provided in a fiduciary capacity. The information provided does not take into account the specific objectives or circumstances of any particular investor, or suggest any specific course of action. Investment decisions should be made based on an investor’s objectives and circumstances and in consultation with his or her financial professionals.
The views and opinions expressed are for informational and educational purposes only as of the date of production/writing and may change without notice at any time based on numerous factors, such as market or other conditions, legal and regulatory developments, additional risks and uncertainties and may not come to pass. This material may contain “forward-looking” information that is not purely historical in nature. Such information may include, among other things, projections, forecasts, estimates of market returns, and proposed or expected portfolio composition. Any changes to assumptions that may have been made in preparing this material could have a material impact on the information presented herein by way of example. Performance data shown represents past performance and does not predict or guarantee future results. Investing involves risk; principal loss is possible.
All information has been obtained from sources believed to be reliable, but its accuracy is not guaranteed. There is no representation or warranty as to the current accuracy, reliability or completeness of, nor liability for, decisions based on such information and it should not be relied on as such. For term definitions and index descriptions, please access the glossary on nuveen.com. Please note, it is not possible to invest directly in an index.
Important information on risk
Investing involves risk; principal loss is possible. All investments carry a certain degree of risk and there is no assurance that an investment will provide positive performance over any period of time. Investing in municipal bonds involves risks such as interest rate risk, credit risk and market risk. The value of the portfolio will fluctuate based on the value of the underlying securities. There are special risks associated with investments in high yield bonds, hedging activities and the potential use of leverage. Portfolios that include lower rated municipal bonds, commonly referred to as “high yield” or “junk” bonds, which are considered to be speculative, the credit and investment risk is heightened for the portfolio. Bond insurance guarantees only the payment of principal and interest on the bond when due, and not the value of the bonds themselves, which will fluctuate with the bond market and the financial success of the issuer and the insurer. No representation is made as to an insurer’s ability to meet their commitments.
This information should not replace an investor’s consultation with a financial professional regarding their tax situation. Nuveen is not a tax advisor. Investors should contact a tax professional regarding the appropriateness of tax-exempt investments in their portfolio. If sold prior to maturity, municipal securities are subject to gain/losses based on the level of interest rates, market conditions and the credit quality of the issuer. Income may be subject to the alternative minimum tax (AMT) and/or state and local taxes, based on the state of residence. Income from municipal bonds held by a portfolio could be declared taxable because of unfavorable changes in tax laws, adverse interpretations by the Internal Revenue Service or state tax authorities, or noncompliant conduct of a bond issuer. It is important to review your investment objectives, risk tolerance and liquidity needs before choosing an investment style or manager.
Nuveen, LLC provides investment solutions through its investment specialists.
This information does not constitute investment research as defined under MiFID.