
A framework for mapping capital to outcomes
Climate solutions investing is shifting from an emissions-focused exercise to an outcomes-based discipline. But this shift is leaving many institutional investors without a clear picture of what climate outcomes their capital is achieving as a whole across their portfolio. This paper introduces Nuveen's Climate Solutions Framework, a way to map climate-aligned investments across three dimensions: the type of investor contribution (signaling, scaling, or innovation capital), the type of solution (substitutes, enablers, removals, or adaptation), and the geography in which capital is deployed.
To illustrate the framework, we apply it to Nuveen's own investment platform as a proxy to show how institutional capital is distributed across climate solutions today. Viewed across the total portfolio rather than mandate by mandate, climate solutions become something that can be managed intentionally and articulated as a coherent strategy. This analysis can be applied to other institutions' holdings.
The state of play
The shift to a solutions focus
For most of the last decade, climate investing organized largely around two activities: decarbonization and thematic allocation. The first reduced portfolio emissions through investment selection (including exclusions) or engagement; the second built exposure to green or clean sectors. Although both retain value, the disclosure apparatus that grew up around them (such as carbon footprint metrics and risk reporting aligned to the Task Force on Climate-related Financial Disclosures) was built to measure emissions rather than outcomes.
That focus is now shifting toward outcomes, as climate solutions move from a thematic sleeve into a more central part of strategic asset allocation. The original case for footprint reduction rested on the theory that if enough investors tilted away from carbon-intensive companies and toward clean ones, they would raise the cost of financing for the former and lower it for the latter. That cost-of-capital divergence would then structurally accelerate the transition.
More recently, that logic has become harder to rationalize as investors have recognized that many of the utilities, industrials and materials companies most penalized by an emissions screen are often the ones best positioned to build and deploy climate solutions. A screen designed to advance the transition can end up steering capital away from the firms carrying it out.
At the same time, the opportunity set has become more investable (Figure 1). Solar, storage and electrification technologies reached a point where they compete on their own economics, and capital has followed. The widely held fear that removing U.S. policy support would stall deployment has not borne out: growth has continued without subsidy, even if at a slower pace than incentives would have produced.
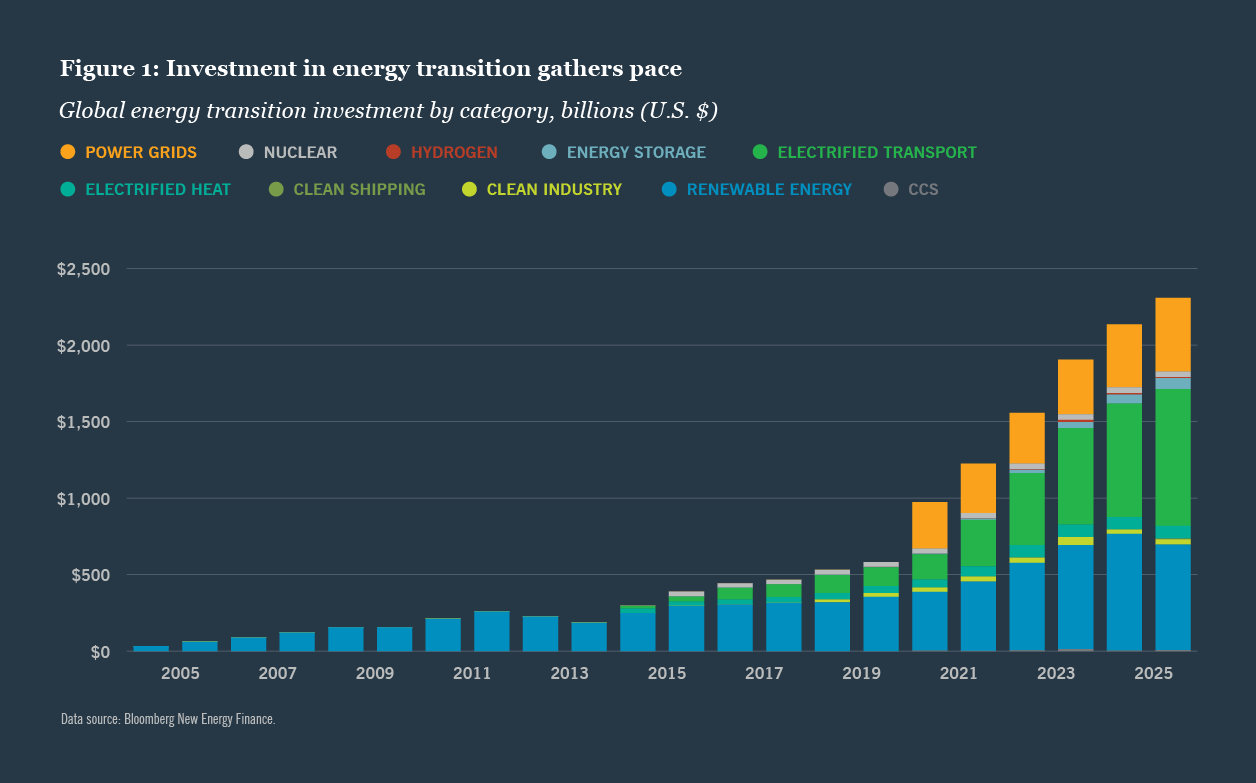
The result is a large and growing pool of capital that is more intentional than net-zero pledges were, though still constrained by mandate and risk limits. For investors with long-dated liabilities and substantial fixed-income allocations, that combination of durable demand and an expanding opportunity set is particularly relevant, as it widens the range of climate exposures available without stepping outside familiar risk parameters.
The measurement gap
The scale of institutional commitment has expanded dramatically. Major institutional asset owners have set explicit dollar targets to be deployed across asset classes. In the U.S., for example, CalPERS has committed over $59 billion to climate solutions out of its $100 billion goal¹ and the NYC Teachers' Retirement System has a $50 billion goal by 2035.² Most targets were based on the reasonable assumption that the opportunity set was broad enough to meet and exceed them, which it increasingly is.
For institutions, the harder problem is not determining what qualifies as a climate solution, but knowing what that capital adds up to once deployed. A credible dollar target met in full may still leave the composition beneath it unresolved: which solutions the capital supports, in what role and in which parts of the world. Nuveen built the Climate Solutions Framework to close that gap.
The Nuveen Climate Solutions Framework
A framework built for the full capital stack
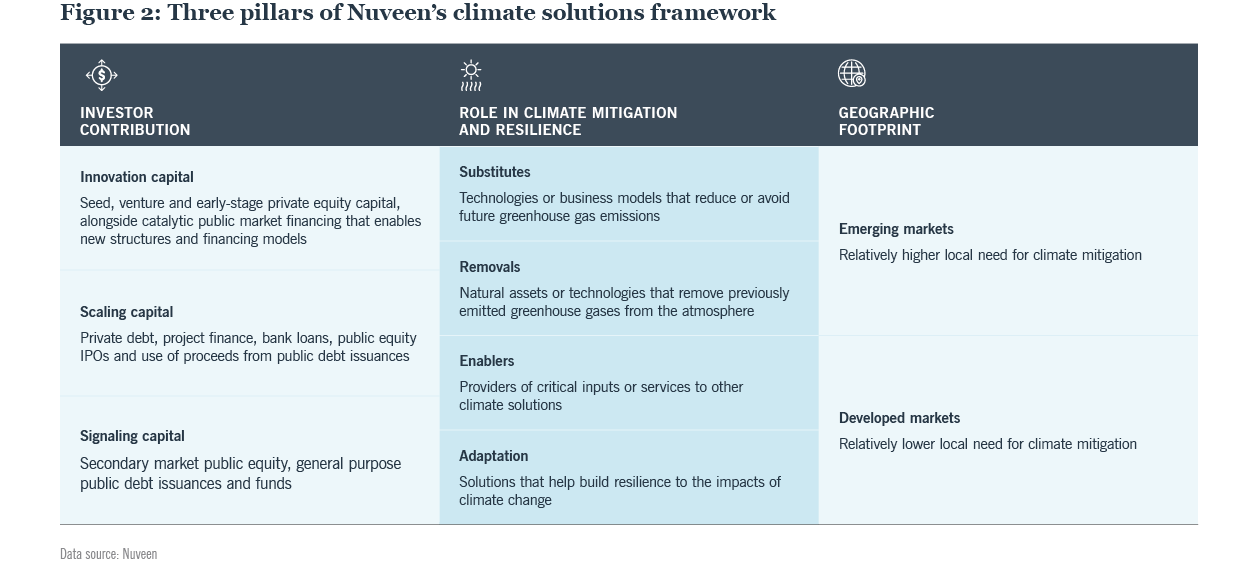
The Climate Solutions Framework grew out of work Nuveen sponsored and shaped with the Global Impact Investing Network (GIIN). In 2025 the GIIN published its Climate Solutions Investing Framework, a practitioner guide built largely around the questions asset owners should ask of their managers. We took the climate-solution characteristics embedded in that guide and refined them into three dimensions an allocator can apply to their portfolio directly: the type of investor contribution, the type of solution and the geography in which the capital is deployed. The framework helps investors go beyond surface-level commitments and identify the core factors that determine the climate impact of their investments.
The type of investor contribution
All forms of capital directed at climate solutions have value, but they contribute in different ways:
- Innovation capital, typically early-stage private equity and venture, helps nascent technologies gain a foothold and reach early deployment. It arguably carries the strongest claim to additionality, since these technologies and structures depend on new capital to advance.
- Scaling capital, including project finance, private credit and use-of-proceeds bonds, takes proven technologies and helps them grow profitably. This is the part of the stack where large fixed-income allocators can often find the most natural fit.
- Signaling capital flows into public equity and general-purpose bonds on the secondary market. It does not provide fresh project capital but communicates the market's continued support for these enterprises, increases liquidity and price discovery, and provides access to retail investors through registered funds.
The type of solution
Most climate solutions capital to date has flowed to substitutes: solar, wind, EVs, energy efficiency, the low-carbon replacements for higher-carbon alternatives. The framework places three other roles into equal view.
- Enablers are the inputs and infrastructure without which substitutes cannot scale, such as critical minerals and the grid. The copper value chain is a natural example, an enabler a climate-motivated investor might overlook even though it underpins many of the technologies they likely already support.
- Removals take carbon out of the atmosphere rather than preventing new emissions, spanning nature-based approaches such as reforestation and technological ones such as direct air capture. They attract far less capital today than substitutes, yet the climate models that reach mid-century targets assume removals at large scale. That capacity will not exist unless it is financed and built well in advance.
- Adaptation and resilience solutions help economies and assets withstand the physical effects of a warming climate, from flood defenses to heat-resilient agriculture. This is the hardest category to identify, because what qualifies depends on how and where an asset is deployed rather than what it is: a bond financing flood-resilient infrastructure in an exposed coastal city clearly qualifies, while the same instrument financing routine drainage work may not. Identifying it reliably therefore takes more than a label. For insurers, this category is especially relevant, since the physical risks these solutions address as investments can be the same risks that shape the liability side of their balance sheets.
The geography of deployment
Where capital is deployed shapes its climate impact, and institutional exposure is heavily concentrated in developed markets. The barriers to emerging-market exposure differ in kind from the barriers across solution types. They are less about technology maturity than about the perception of risk, the cost of currency hedging and a status-quo bias toward markets where managers already have local teams. The gap is therefore as much about investor willingness and investment infrastructure as about the availability and economics of genuine solutions.
Nuveen's inventory
Holding up a mirror to institutional allocations
Nuveen applied its Climate Solutions Framework across its own platform. That was a significant undertaking, since the analysis classified hundreds of thousands of holdings, not just strategies, and did not rely on the name or stated objective of a strategy. In addition, public equity, private credit, real estate and natural capital each rely on different data, reporting standards and classification conventions adding to the complexity. The resulting analysis identified roughly $54 billion in climate-aligned AUM and revealed several patterns that carry broader implications for institutional investors.
The inventory reflects where Nuveen's clients, including the $326 billion TIAA general account,3 have chosen to invest across separate mandates. It offers a useful mirror of how institutional capital is distributed across climate solutions in aggregate, and arguably a closer proxy for the broad market than any single allocator's portfolio. The patterns that follow are best understood not as an assessment of those choices, but as a way of seeing where exposure concentrates, and a prompt for any investor to ask whether the shape of their own exposure reflects their intentions.
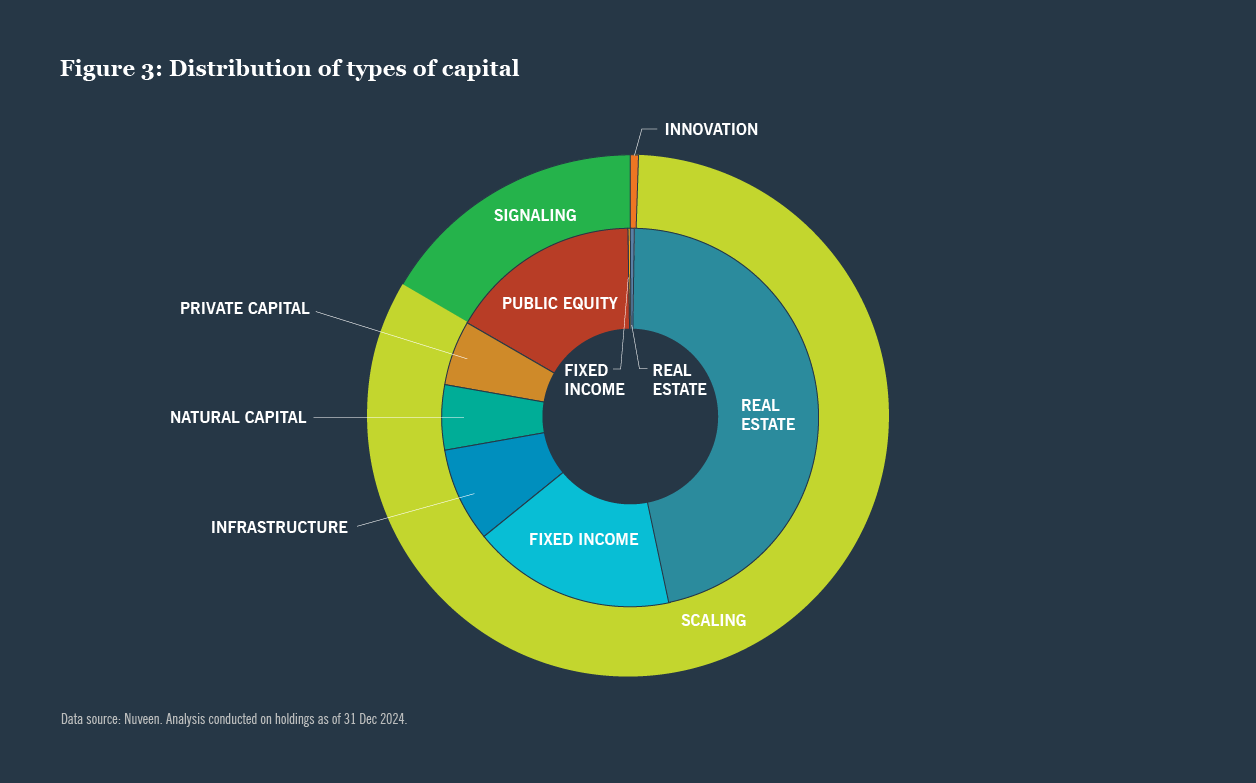
By type of contribution (capital role): Signaling and scaling capital dominate contribution type with relatively little innovation capital. This is consistent with the risk and liquidity constraints most of Nuveen's clients operate under. Real estate and impact fixed income strategies contribute heavily in these categories.
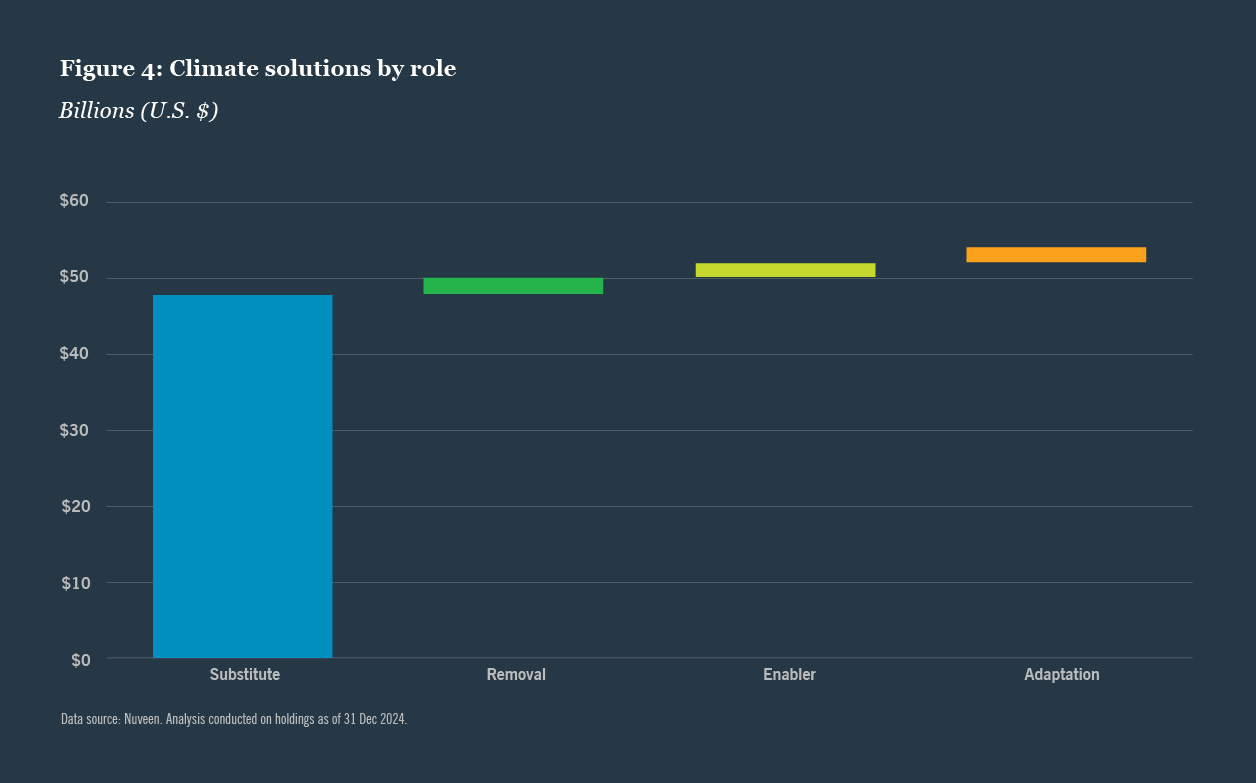
By role in mitigation and resilience: Substitutes account for the vast majority of investment type, with enablers underrepresented. Removals and adaptation are lightly represented for different reasons: the former because the market is nascent, the latter because it resists label-based identification. However, Nuveen's exposure in these areas may be higher than most thanks to our natural capital investment capabilities.
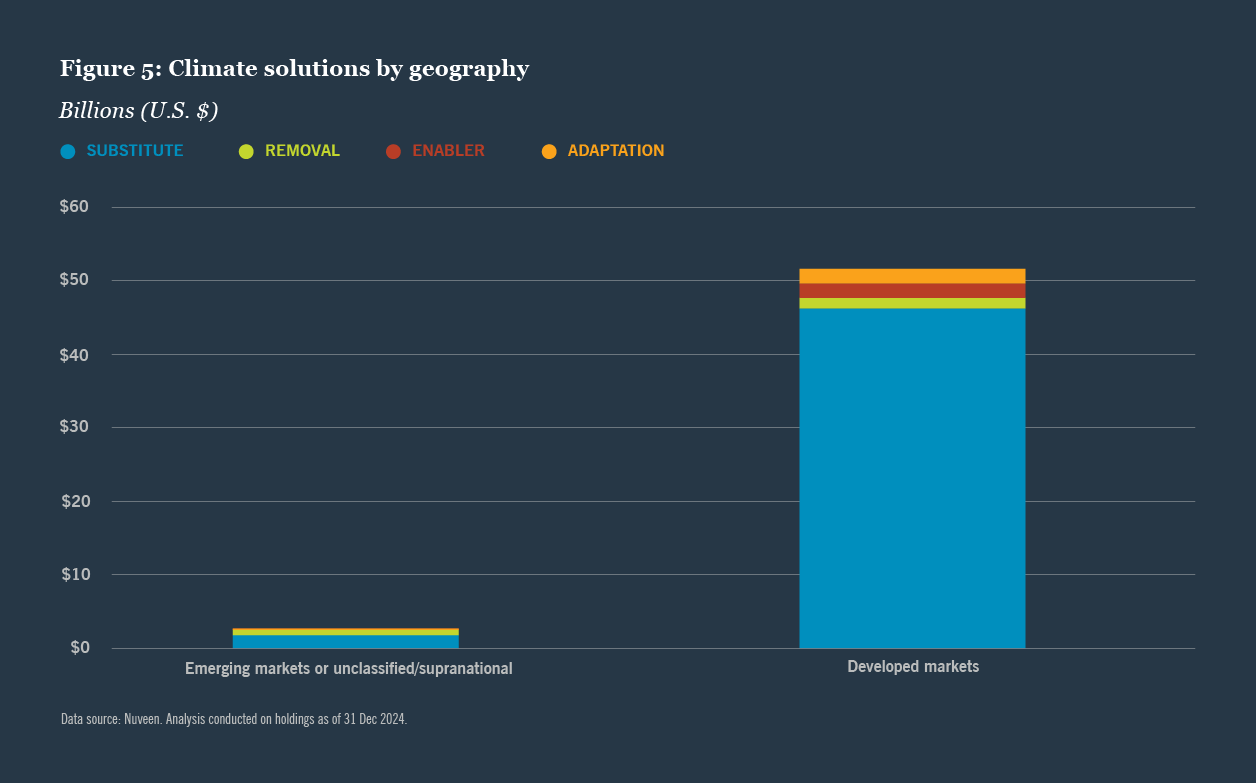
By geographic footprint: Emerging-market exposure is limited, consistent with the structural barriers described earlier.
The gaps the inventory reveals are not equally hard to close, if investors so choose. Some thinly represented categories, such as nature-based removals, are more accessible than the low exposure suggests. These are reachable through natural capital strategies that remain underused relative to their potential to absorb capital productively.
Accessibility is only part of the story. A more common misconception is that climate exposure means stepping outside an allocator's existing risk and return parameters. In practice, climate solutions now span the full risk-reward spectrum, from early-stage growth equity through to senior secured lending. Whatever an allocator's constraints, there is a growing range of options to fit within them.
Commercial Property Assessed Clean Energy (C-PACE), for example, sits at the senior, secured end of the spectrum. It funds energy upgrades and renewable installations in commercial buildings through financing secured by a senior tax assessment that sits ahead of the mortgage and is ringfenced to the qualifying improvements. The result is climate-related lending with the security and predictable cash flows of investment-grade debt, fitting naturally alongside the fixed-income holdings on many institutional balance sheets.
Energy infrastructure credit is another example of the broadening climate solutions toolkit for income-oriented allocators. It applies the private-credit playbook to the power and energy system, financing storage, energy efficiency, grid-enabling assets and distributed solar through well collateralized loans with shorter maturities and contracted cash flows. For allocators, and insurers in particular, the appeal is that these climate solutions arrive in a form that behaves like the private credit they already hold: senior, collateralized, structurally protected and historically lower-defaulting than comparable corporate credit. In other words, it is scaling capital for the buildout of the electricity system, packaged to fit an existing fixed-income mandate.
How asset owners can use the framework
The Climate Solutions Framework works as a tool institutions can use to assess their exposure, allocate with intention and report on outcomes.
Assess exposure beyond labels
The first use is diagnostic. It means looking beyond labels to understand which climate solutions a portfolio already holds, in what role and in which regions. An unlabeled energy fund may be full of climate solutions, while a labeled climate product may contribute less than its name suggests. Making these distinctions at scale is challenging. While sustainability datasets help assess exposure across hundreds of thousands of public holdings, they only serve as a starting point, not the final word. Turning raw exposure data into a real assessment takes a framework applied asset class by asset class, each with criteria suited to how capital is actually deployed.
Allocate with intention
Seeing the composition of a portfolio's climate exposure turns the framework into a decision tool. Viewing exposure through the framework makes investment choices and manager selection more deliberate. For example, a portfolio with no exposure to removals or emerging markets may reflect a considered decision or an overlooked opportunity. The framework prompts such questions.
Report outcomes to stakeholders
Institutions answer to many stakeholders. The framework helps turn a disparate set of investments into a strategy they can clearly explain, providing a consistent way to show what capital is doing across solutions, roles and regions.
Nuveen reported its climate solutions inventory in our most recent Climate and Nature Report to highlight the important role of these investments on behalf of our clients, while also recognizing areas for future growth and deployment.
The road ahead
Climate solutions investing remains an evolving field. Taxonomies are still maturing and data vendors are catching up. Nuveen is working to shape how these standards form, through its role in developing the GIIN framework and the methodology it built to apply that framework across asset classes. We are not alone. Rhodium Group's Transition Acceleration Framework, for example, works to identify the most impactful and efficient energy transition investments, and our partners at the GIIN continue to test and iterate on their framework with asset owners.
The frontier beyond classification is measurement. Deciding whether an investment counts as a climate solution is a first step. The harder and more useful question is how much climate impact a given dollar produces. Work on avoided emissions is advancing toward an answer, supported by efforts such as PCAF's recent guidance on financed avoided emissions and Project Frame's methodologies for private markets, alongside related ideas such as carbon yield, or the mitigation achieved per dollar invested. All of this points to where the discipline is heading, and to the kind of analysis that will eventually let allocators compare opportunities on impact as readily as they compare them on return.
The Climate Solutions Framework gives any investor a way to see their climate solutions exposure through these three dimensions — the type of capital they provide, the role it plays in mitigation and resilience, and where that capital is deployed — and to ask whether its composition is intentional. Seeing climate solutions clearly is the first step. Acting on that view across the full breadth of public and private markets is where durable outcomes take shape, and is the work Nuveen was built for.
Related articles

Long-term value, active stewardship: 2025 report

Nuveen Natural Capital Sustainability Report 2026

Decoding data centers: Sustainability due diligence across the value chain


Contact us









- +1 312 917 7700
- 333 W Wacker Drive, Chicago, United States of America
Endnotes
1 www.calpers.ca.gov, 7 Nov. 2025
2 www.comptroller.nyc.gov, 10 Sep 2026
3 AUM as of 30 June 2026