
Building AI is expensive. Proving it can generate returns may be even harder.
Twenty-eight companies, less than 6% of the S&P 500, account for roughly half its market value1 on the strength of a shared bet: that trillions in AI spending will eventually pay off. The Bank for International Settlements (BIS), the central bank for central banks, just ran the numbers on what happens if it does not.
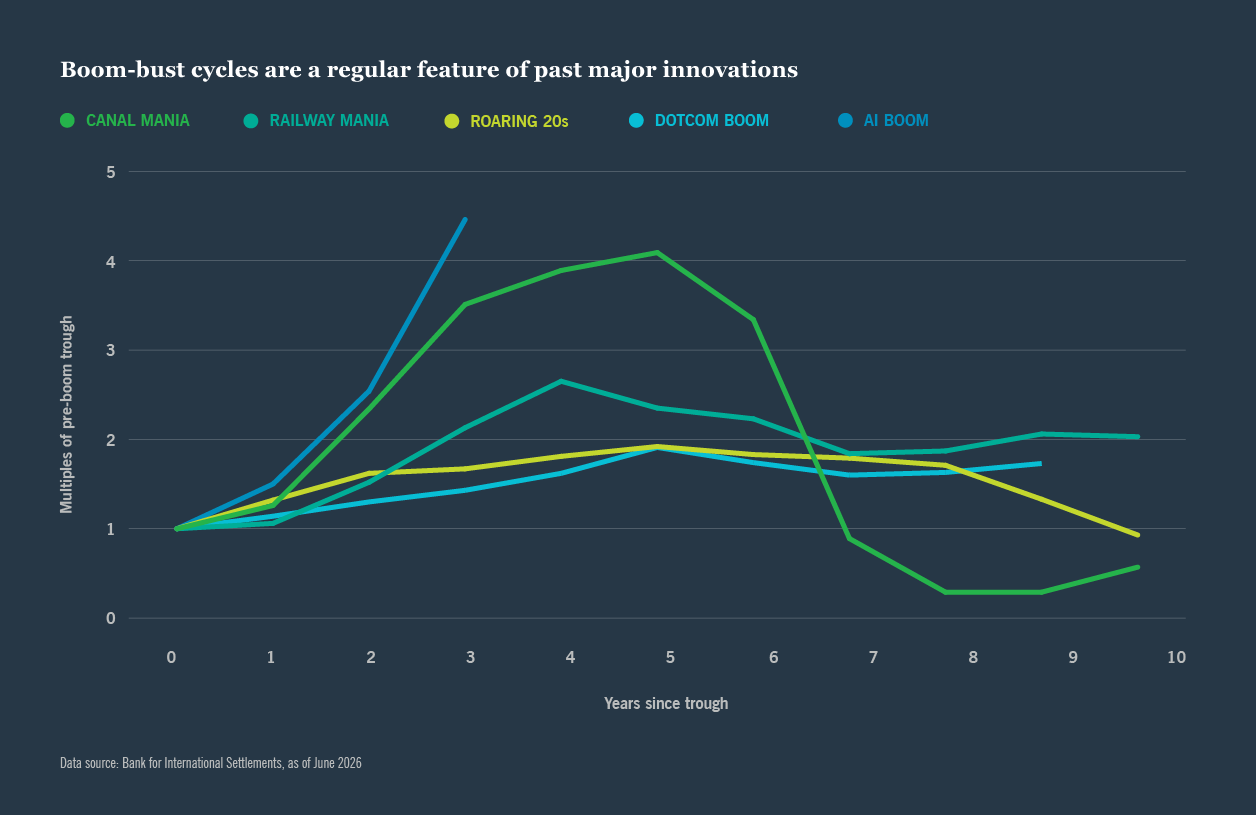
The BIS rarely sounds alarmist, which is why its ‘boom to bust’ findings stand out. Its latest Annual Economic Report models a downside scenario in which the combined economic impact across hyperscalers, AI labs and semiconductor companies turns negative by several trillion dollars, and warns that today’s AI ecosystem is unusually interconnected. Long-term commitments, infrastructure investment and strategic partnerships mean weakness in one part of the value chain could spread faster than investors expect.
The BIS draws the comparison to the canal mania of the 1830s, the railway boom of the 1840s and the dotcom era.2 They involved transformative technologies and investors overestimating how quickly returns would justify the capital invested.
But that is not the only way to read this. AI’s spending pattern looks a lot like the infrastructure cycles that came before it where early overconsumption gives way to digestion, then reacceleration. This is especially the case for cloud computing, according to our equity colleagues. The digestion phase has begun as companies tighten usage, switch to cheaper models and put guardrails on spend. That slows growth in the near term even as underlying demand stays intact while also generating near-term productivity gains.
The leaders still lead, but selectivity is the new edge
It is a question Nuveen’s Global Investment Committee has been asking too, from a different angle: as AI drives most of the market’s returns, are investors being rewarded for picking winners or for being exposed to a handful of names? That’s the tension at the core of our Midyear Global Investment Committee Outlook, what we call the concentration paradox.
As AI drives most of the market’s returns, are investors being rewarded for picking winners or for being exposed to a handful of names?
AI is the dominant force behind market returns, leaving market leadership narrow. The paradox is that investors do not need to abandon the market leaders but need to become more selective about them. U.S. large caps still carry advantages, such as high productivity, solid corporate earnings growth, a tax and regulatory backdrop that rewards scale. And we expect markets to keep rewarding capex that is properly deployed.
The paradox is that investors do not need to abandon the market leaders but need to become more selective about them.
But the AI trade is splitting in two, and the split traces back to incentives, not just balance sheets. Hyperscalers may be investing defensively, just to stay relevant as AI reshapes where profits sit across software and digital businesses. Enterprises, on the other hand, are putting money behind the use cases with the clearest near-term payoff. That distinction separates this latest capex from undisciplined spending; some of it is strategic necessity, some economic return, and the market is unlikely to reward both the same way.
Companies with proprietary data advantages, customised client solutions and exposure to the physical infrastructure of the AI buildout look better positioned to navigate disruption, in our view. Software and IT services companies with stretched valuations and without a credible path to monetizing AI sit in the more vulnerable camp.
Bets on and around AI: our highest conviction views
As markets become more discerning, opportunities should broaden out across sectors, asset classes and regions where AI adoption, not simply AI spending, drives long-term value creation.
In equities, we favour dividend growers with strong free cash flow and second-order AI beneficiaries over the most capital-intensive parts of the value chain. This includes electrification, industrials, networking, robotics and select software. Hyperscaler exposure is becoming differentiated as power availability, energy costs and water constraints become key economic considerations.
Outside the U.S., we remain selective rather than broadly bullish. Banks, defence and industrials continue to stand out across developed market equities, providing diversification from AI while opportunities within emerging markets remain concentrated in AI-enabled supply chains and countries demonstrating improving governance.
Banks, defence and industrials continue to stand out across developed market equities, providing diversification from AI.
The BIS also highlights how interconnected financing relationships could amplify disappointment if returns fail to materialize. That reinforces our preference for a barbell approach in credit centered on higher-quality income opportunities. Preferred securities and senior loans continue to offer attractive carry, while private credit increasingly rewards disciplined underwriting and covenant quality rather than broad sector exposure. Our U.S. mid-market lenders see opportunities in old economy exposures that are relatively insulated from AI disruption risks, namely packaging, waste and storm water management, pest control and commercial landscaping.
Real assets tell a similar selectivity story. Infrastructure debt, healthcare and grocery-anchored real estate, selected municipal bonds and farmland all tend to offer resilient cash flows and differentiated returns.
The case for staying invested
The BIS presents a downside scenario, not a forecast. Markets might keep rewarding today’s leaders. If productivity gains show up faster than expected and enterprise adoption broadens quickly, today’s market leaders could keep extending their advantage despite elevated valuations.
That is why diversification matters regardless of which scenario plays out. If the BIS scenario materializes, the positioning outlined above should hold up better than broad index exposure. If, however, leadership keeps compounding, that positioning should still have upside.
What to watch
Three developments will likely show how this plays out:
- Earnings: Does the market begin rewarding AI profitability more than AI investment?
- Credit: Do AI-linked credit spreads continue diverging from equity valuations?
- Leadership: Does market performance broaden beyond today’s concentrated winners?
The next trillion dollars of market value are unlikely to be awarded to whoever spends the most. Those who earn the most on what they have already spent are the likely beneficiaries. Identifying those winners will increasingly be top of mind for markets.
Related articles


About the author

Contact us


- +44 20 3727 8000
- 201 Bishopsgate, London, United Kingdom
Endnotes
Sources
1 JPMorgan, Nuveen Global Investment Committee Midyear Outlook, June 2026
2 Bank for International Settlements, Annual Economy Report, June 2026
