Corn, soybean and wheat prices matter to farmland investment. But investing in leased annual cropland is not the same as taking a direct position in those commodities. Here’s why:
Historically, leased farmland returns have come from two main sources: recurring lease income and appreciation of the underlying land.
- Lease income is paid by the on-farm operator and shaped by local rental markets, tenant demand and property attributes. While commodity prices affect operator profitability, lease terms are typically set in advance, helping convert that exposure into a more stable income stream for the farmland owner and reducing the impact of seasonal swings in crop prices and yields.
- Land appreciation reflects longer-term changes in productive capacity and demand for agricultural land. It is generally shaped by broader farmland market dynamics and multi-crop suitability than short-term moves in any single commodity
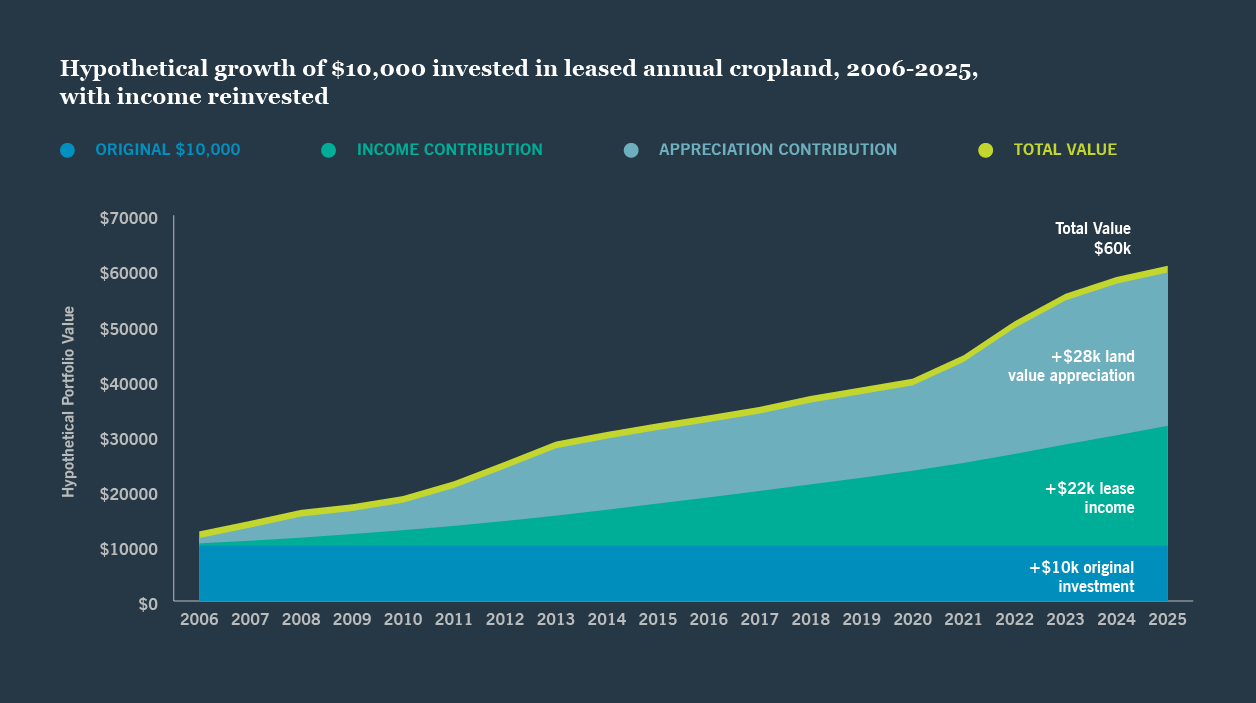
Over the 20 years through 2025, NCREIF Farmland Index for Leased Annual Cropland generated an annualized total return of approximately 9.5%, comprising approximately 3.8% from income and 5.5% from appreciation. The chart below shows the return profile for a hypothetical $10,000 investment, with income reinvested, growing to approximately $59,585.
The point is not only the headline return, but where it came from: recurring income alongside participation in the long-term value of productive agricultural land. That combination distinguishes leased farmland from simply taking a view on the next commodity cycle.
Related articles

Pathways for investing in biodiversity

Tariffs on Canadian lumber could boost U.S. production

Growing renewable fuels market continues to shape U.S. soybean demand
Contact us

















- +44 20 3727 8000
- 201 Bishopsgate, London, United Kingdom
Endnotes
Chart Source: NCREIF US Farmland Index. To calculate hypothetical portfolio performance, we use annual NCREIF Leased - Annual Cropland Calendar Year Return (%) data from 2006 through 2025. Specifically, annual income and appreciation are reported by NCREIF in each of the 20 years from 2006 to 2025 and applied to the opening portfolio value and reinvested annually. The beginning $10,000 portfolio value plus cumulative income and appreciation contributions equals total ending value. The illustration is hypothetical and based on returns from an index; investors cannot invest directly in an index. NCREIF reported returns are gross of any management fees, fund expenses, transaction costs, taxes, leverage, vehicle structuring costs, cash drag or other implementation considerations that would affect actual investor returns. Component returns may differ slightly from reported total return because of NCREIF calculation conventions and rounding. Past performance is not indicative of future results.
Hypothetical performance/characteristics is shown for illustrative and informational/educational purposes only. This hypothetical information presented is not in regards to any portfolio or investment advisory services available through Nuveen, LLC or any of its investment specialists. Actual results may vary. Past performance is not indicative of future results. It is not possible to invest directly in an index.
Glossary
NCREIF US Farmland Indexis a quarterly time series composite return measure of investment performance of a large pool of individual farmland properties acquired in the private market for investment purposes only.
Important information on Risk
Past performance is no guarantee of future results. All investments carry a certain degree of risk, including the possible loss of principal, and there is no assurance that an investment will provide positive performance over any period of time. Certain products and services may not be available to all entities or persons. There is no guarantee that investment objectives will be achieved.
All investments carry a certain degree of risk and there is no assurance that an investment will provide positive performance over any period of time. As an asset class, agricultural investments are less developed, more illiquid, and less transparent compared to traditional asset classes. Agricultural investments will be subject to risks generally associated with the ownership of real estate-related assets, including changes in economic conditions, environmental risks, the cost of and ability to obtain insurance, and risks related to leasing of properties.