
TOOLS
Login to access your documents and resources.
Listen to this insight
~ 21 minutes long
Geopolitical uncertainty, water scarcity in the Western U.S., shifting state tax policy and concentrated fiscal stress in New Jersey school districts are each testing municipal credit in distinct ways. Understanding which issuers are prepared — and which are not — is what separates credit risk from opportunity.
Highlights
- The municipal market has historically weathered geopolitical shocks well, though the Iran conflict’s energy supply crisis warrants careful sector-level monitoring.
- New Colorado River guidelines could materially impair water utilities that have not proactively prepared for significant supply reductions.
- Washington State enacted a 9.9% income tax on households earning over $1 million, potentially boosting in-state demand for tax-exempt municipal bonds.
- New Jersey school districts’ recent rating downgrades reflect issuer-specific pressures and do not signal a state.
History favors the patient muni investor — but 2026 demands careful credit selection.
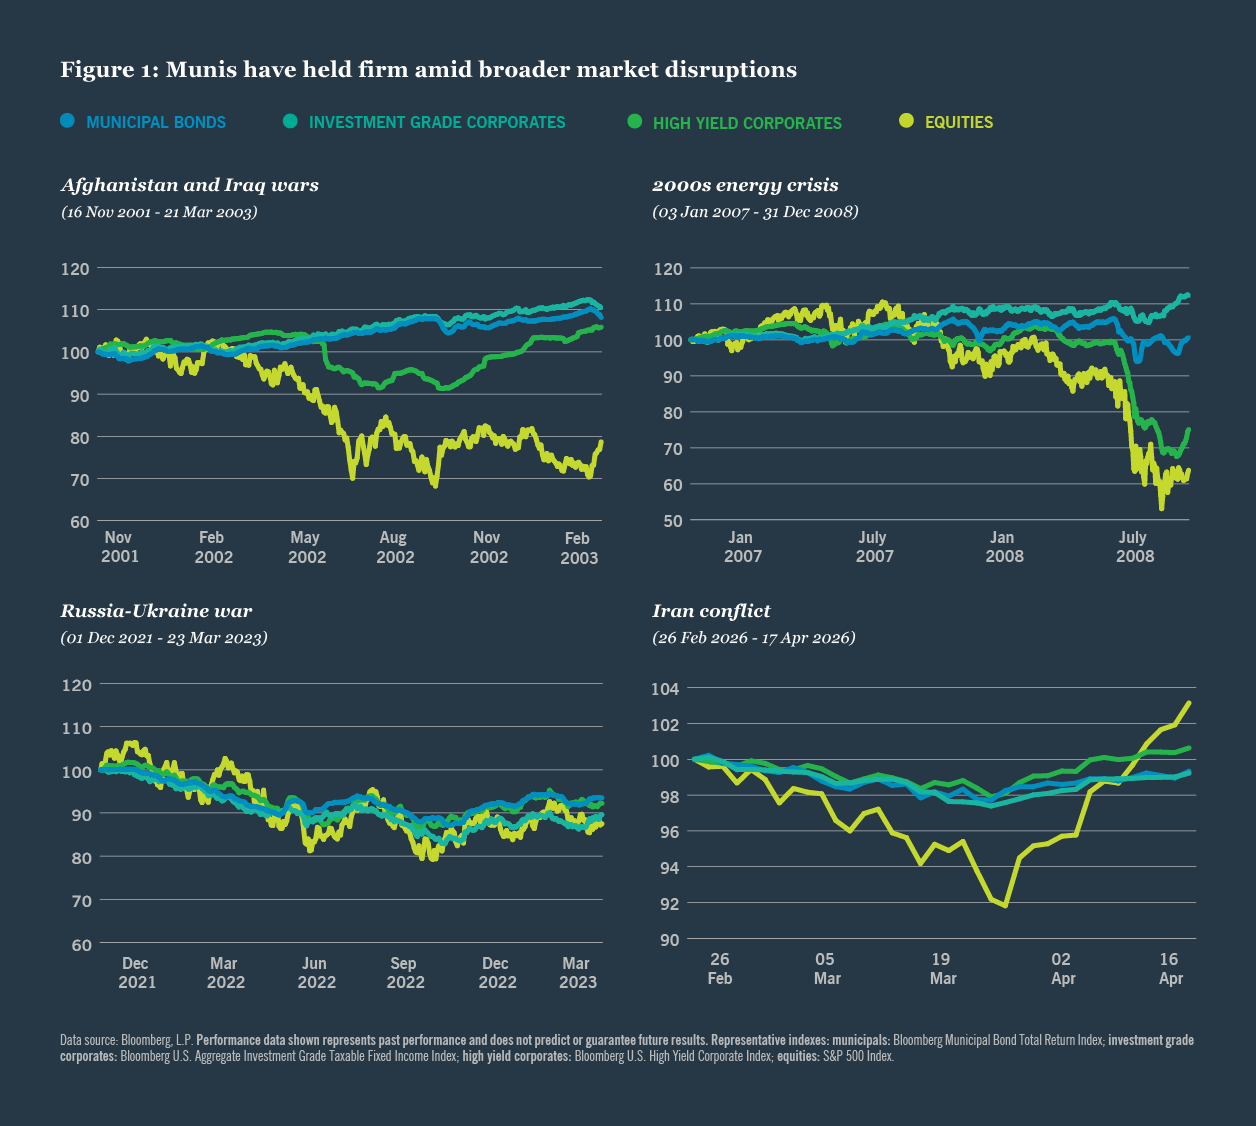
Munis have weathered geopolitical storms before
The municipal market has proven remarkably resilient during periods of geopolitical uncertainty and oil price volatility. Since 2002, the Bloomberg Municipal Bond Total Return Index has recorded annualized volatility of approximately 3.3%, compared to a respective 4.3%, 5.0% and 19.2% for the Bloomberg U.S. Aggregate Investment Grade Taxable Fixed Income, Bloomberg U.S. High Yield Corporate and S&P 500 indexes over the same period.
That stability has held across four major oil price shocks: the lead-up to the Afghanistan and Iraq Wars (December 2001 – March 2003), the 2000s Energy Crisis (peaking in 2007 – 08), the first year of the Russia-Ukraine War (February 2022 – March 2023) and the current Iran conflict (February 2026 – present).
During these episodes, municipal annualized volatility rose only modestly to 3.8%, while the other three indices saw sharper increases to 5.4%, 6.3% and 24.1%, respectively (Figure 1).
History offers context, but this cycle has distinct risks
While the underlying causes of each prior episode differ, examining market behavior across them offers meaningful context for the current environment. With the exception of the Russia-Ukraine conflict, municipal total returns were positive in the 12, 24 and 36 months following the onset of each crisis, averaging annual returns exceeding 6%.
State and local tax revenues remained positive in the 12 to 24 months following each episode, even if growth moderated. Property taxes, utility revenues and other pledged revenues are relatively insensitive to macroeconomic uncertainty, and their breadth has historically provided a meaningful cushion. Municipal underperformance during the Russia-Ukraine period was driven by rising interest rates in response to pandemic-era inflation — not the conflict itself.
The Iran conflict’s economic impact is likely to outlast the direct fighting, as sustained price and supply uncertainty generates inflationary pressure and slower global growth. Prolonged elevated interest rates could delay infrastructure investment and complicate issuers’ borrowing plans. Municipal credit is nonetheless insulated by the essential nature of public services and locally generated revenues. Most issuers enter this period with strong balance sheets, though supply chain disruptions may increase project costs and operating expenses — risks that warrant ongoing monitoring.
Fuel costs pressure airports unevenly
Elevated fuel prices represent a modest but uneven headwind for U.S. airports. Airlines have historically offset fuel cost increases through fare adjustments and capacity discipline, but sustained price increases can suppress discretionary travel demand and pressure key revenue streams including parking, concessions and passenger facility charges.
Domestic travel demand is holding for now, though some airlines are cutting capacity on off-peak routes and raising baggage fees. Larger hub airports with diversified demand profiles are better positioned to manage near-term disruption; smaller, leisure-oriented airports face greater pressure if elevated jet fuel prices persist.
Commuter demand cushions toll road revenues
High fuel prices can modestly reduce discretionary traffic on toll roads, but impacts are often mitigated by steady commuter demand and travelers’ willingness to pay for faster, more predictable travel times. Toll roads in congested corridors, or those employing dynamic pricing, tend to maintain more resilient volumes and revenues despite elevated fuel costs.
Oil-dependent utilities face the sharpest credit pressure
Public power utilities relying heavily on oil-fired generation face meaningful credit pressure when geopolitical tensions drive fuel costs higher. Rising prices directly inflate operating expenses and can strain liquidity, weaken debt service coverage and pressure credit quality if sustained.
Pass-through of higher fuel costs to ratepayers is a common structural protection, but implementation takes time and can face political or regulatory resistance, leaving utilities temporarily exposed to margin compression. Some issuers have managed this risk through hedging agreements that lock in fuel costs over defined periods.
Strong balance sheets buffer near-term state and local budget stress
Higher inflation may lift sales tax revenues in the near term, but slower growth and elevated fuel costs could depress other consumer spending, partially offsetting that benefit. Sales tax collections rose 3.4% in 2025 and most states budgeted for similar growth in 2026, leaving any shortfall as an unplanned pressure.
Delays in procuring essential equipment and rising maintenance costs add further strain, as do higher capital project estimates that may drive up debt levels. Elevated debt service combined with reduced political appetite for revenue increases could pressure budgets in the years ahead. Favorably, state and local governments enter this period with healthy balance sheets and broad revenue and expenditure flexibility.
Energy states are well positioned, but volatility remains
States with significant energy sector exposure — including Alaska, Louisiana, New Mexico, North Dakota, Oklahoma, Texas, West Virginia and Wyoming — have benefited from the Trump administration’s focus on domestic fossil fuel production and reduced regulation. Higher oil prices are likely to boost severance, sales and property tax revenues in the near term. Most of these states have implemented measures to manage revenue volatility and maintain strong reserve policies or mandate that excess revenues be directed toward one-time expenditures.
Defense concentration could lift select state economies
States with significant defense industry presence — including California, Florida, Georgia, Texas and Virginia — could benefit from increased federal military spending, translating into higher employment and income tax revenues. Communities hosting military installations may also see a meaningful economic boost if the conflict extends over a longer period.
The original Colorado River Compact can no longer reliably meet the needs of a much larger regional population.
Fertilizer spike compounds pressure on farm states
Agricultural states may see economic output slow. Supply chain disruptions from the closure of the Strait of Hormuz have driven fertilizer prices up more than 30% as of late March, compounding the impact of higher diesel costs.
The Gulf region supplies nitrogen fertilizers that typically account for 20% to 30% of corn production costs. Higher fertilizer prices may shift production away from nitrogen-intensive crops while livestock producers face higher feed and grain input costs, pressuring commodity prices and contributing to inflation.
Supply chain stress widens the gap between strong and weak
Health care credits face headwinds if supply chain disruptions and pharmaceutical tariffs set to take effect this summer drive up expenses. As cost pressures mount, credit differentiation is likely to widen considerably. Well-capitalized systems are better positioned to absorb the strain, while financially marginal operators face a significantly more difficult road ahead.
Decades of drought out West force a reckoning
The Colorado River is a critical source of fresh water for 40 million people in the Western U.S. A severe, decades-long drought and chronic over-allocation have reduced the river’s levels by roughly 20%, and the reservoirs that form the backbone of the system are dangerously low. As a result, the original Colorado River Compact — drafted in the early 1920s to equitably distribute water among seven states — can no longer reliably meet the needs of a much larger regional population.
Negotiations among the seven states have dragged on for years without consensus, and deadlines set by the U.S. Bureau of Reclamation have passed without resolution. If no voluntary agreement is reached by October 1, 2026, the Bureau will impose default guidelines, potentially enforcing mandatory cuts on water users for the first time in federal history.
The new guidelines are likely to create distinct “winners” and “losers” among water utilities. The Bureau’s recent Environmental Impact Statement calls for aggregate water reductions of up to 27% from the Colorado River, with agriculture — which accounts for roughly 70% of river usage — bearing the largest share of cuts.
Arizona faces the most acute near-term exposure due to its junior water rights. Junior rights are subordinate to senior rights and are satisfied only after senior holders receive their full allocation. Arizona draws roughly 36% of its water from the Colorado River through the Central Arizona Project canal system, which serves many of the state’s largest cities.
Because this project was completed in the early 1970s, its water rights are subordinate to other users, leaving it vulnerable to projected cuts ranging from 33% to 69%. Nevada, which relies on the river for about 70% of its supply, also holds junior water rights and faces reductions ranging from 24% to 67%.
California, despite holding senior water rights, could see cuts of around 30%. The Upper Basin states — Colorado, Utah, Wyoming and New Mexico — face no mandatory cuts, but remain exposed to water-stress conditions, low storage levels at Lake Powell and Lake Mead, and their obligation under the original Compact to deliver 7.5 million acre-feet annually to downstream states.
When reservoir levels fall below critical storage thresholds, the Bureau of Reclamation can trigger operational constraints that limit how much water Upper Basin states may use before passing flows downstream, effectively forcing conservation regardless of any formal cut declaration. A prolonged drought or further reservoir decline could leave these states unable to meet both local demand and their downstream delivery commitments.
Most municipal water utilities across the seven states have sufficient financial flexibility to manage the short-term impact of projected supply cuts. Median debt service coverage stands at 2.1x and basin utilities hold a median of 600 days’ cash on hand. Over the long term, however, utilities may be forced to significantly raise customer rates as they develop costlier alternatives and diversify supply sources.
Large utilities are better positioned than smaller ones to absorb these costs, given their ability to spread fixed infrastructure expenses across a broader customer base and access capital markets on more favorable terms. Smaller utilities face a harder road, with higher borrowing costs potentially leading to deferred investment and increased rate burdens on customers.
In response to supply uncertainty, utilities should plan conservatively and adopt proactive withdrawal limits. Many have already invested in resilience through conservation programs, water reuse, expanded storage and supply diversification. Those that have not prepared for reduced Colorado River allocations — particularly those already managing aging infrastructure and rising costs — will struggle to maintain credit quality.
Collaboration among users remains essential to reducing supply volatility, aligning capital plans and strengthening financial resilience. A new Environmental Impact Statement is expected this summer, which could help facilitate an agreement before the October deadline.
Washington breaks its no-income-tax tradition
Washington State’s newly enacted millionaires’ tax marks a significant departure from the state’s long history of not taxing income. Beginning January 1, 2028, the law will impose a 9.9% income tax on households earning more than $1 million annually. To prevent double taxation, individuals subject to both the existing capital gains tax and the new 9.9% rate may deduct capital gains taxes paid before calculating their liability.
Notably for municipal bond investors, interest on Washington-issued state and local bonds will likely be exempt from the new tax, potentially increasing in-state demand for the state’s debt.
The state estimates the tax will generate more than $3.0 billion in annual revenue for the General Fund — roughly 4.7% of FY25 revenues — modestly reducing Washington’s heavy reliance on sales and excise taxes.
Additional provisions in the legislation include sales tax exemptions on diapers, over-the-counter medicines and hygiene products, tax relief for small businesses grossing less than $250,000 annually, an expansion of the Working Families Tax Credit to 460,000 additional families, funding for free school meals and an allocation of 5% of future revenues toward childcare and early learning programs. The 9.9% tax is expected to affect approximately 30,000 taxpayers, or about 0.5% of the state’s population.
The law faces likely legal challenges. Washington’s constitution permits an income tax but requires it to be applied as a flat rate. In 2010, voters approved a graduated income tax that was subsequently struck down by the state Supreme Court for failing to meet that uniformity requirement. Some Democratic lawmakers are pursuing constitutional amendments to further legitimize the 9.9% rate, though the bar is high — any amendment requires a two-thirds majority in the legislature and statewide voter approval.
Concerns have emerged that high-income earners may leave the state. However, tax changes have not historically triggered significant population shifts in other states that have enacted similar increases. A recent example is Massachusetts’ 4% surtax on income over $1 million, which has not produced a measurable exodus of high-net-worth residents.
New Jersey school districts stress is real but concentrated
Several New Jersey school districts are navigating a period of fiscal stress, as evidenced by recent rating downgrades. These pressures, however, are concentrated within a small number of districts and do not represent a widespread statewide challenge. Fiscal Year 2026 marks the final year of a multi-year phase-out of adjustment aid, a supplemental funding mechanism created to ease districts into a revised state aid formula.
Roughly half of New Jersey school districts never received adjustment aid and were unaffected. Among those that did, state aid fell by an average of 10% over the phase-out period, though a few districts saw far steeper reductions. The wealthiest districts — best positioned to absorb cuts — had aid phased out almost immediately, while middle-class and lower-income districts received a longer transition period.
The phase-out was further complicated by the pandemic and its associated federal relief funding. Federal aid allowed many districts to sustain prior spending levels without raising property taxes or cutting expenditures, effectively masking the cumulative impact of declining state support.
As that federal funding was exhausted, districts that failed to proactively adapt to the new formula confronted a sharper fiscal adjustment. Jackson Township and Toms River Regional school districts are notable examples. While the state has permitted districts to exceed a 2% statutory property tax levy cap to offset aid declines, such increases are not always politically feasible.
With FY26 likely representing the trough, the path forward looks more stable for most New Jersey school districts.
Despite these pockets of pressure, the broader sector retains meaningful credit strengths. State funding for school districts increased 3.6% in FY26, and most New Jersey districts benefit from above-average wealth metrics and stable enrollment. Statewide, public school enrollment grew 0.4% in 2024, contrasting with national declines. Fixed costs remain relatively contained, as the state assumes responsibility for teacher pension and healthcare obligations, and debt burdens are modest given limited demand for new facilities.
With FY26 likely representing the trough, the path forward looks more stable for most districts. Annual state aid reductions are expected to be capped at 3% in FY27, providing greater budget predictability, and proactive districts are well-positioned for gradual improvement. The divergence in outcomes, however, underscores why individual credit analysis remains essential. Identifying which issuers have the financial resilience to navigate this transition is precisely where careful, bottom-up research adds value.
Related articles

Treasury yields fell sharply as oil prices eased, credit spreads tightened, and fixed income posted broad positive returns. Explore Nuveen's weekly fixed income outlook.

Nuveen explores economic resilience and strategic credit positioning across high yield, senior loans, and preferred securities. Discover quality-driven insights.

Upcoming Solvency II reforms are set to transform European insurers' approach to securitised assets by aligning capital charges with actual credit risk for the first time in decades. The U.S. market offers compelling opportunities for insurers seeking enhanced yield, diversification, and stronger capital adjusted returns.

Contact us


- +44 20 3727 8000
- 201 Bishopsgate, London, United Kingdom
Endnotes
Sources
SAPIMAIN Municipal Market Total Return Index
I14053US Bloomberg High Yield Hospital Total Return Index
U.S. Census Quarterly Summary of State & Local Tax Revenue Data Tables
MMA Weekly Outlook
S&P: It’s Too Soon For A Boom Though A Bust Could Sting Mineral-Producing U.S. States, 31 Mar 2026,
https://www.spglobal.com/ratings/en/regulatory/article/its-too-soon-for-a-boom-though-a-bust-could-sting-mineral-producing-us-states-s101677727?utm_campaign=uspf&utm_source=newsletter&utm_medium=link&mkt_tok=NDQ4LURaRi00NzcAAAGhBvLqVEaVnHqdJK4gtpy4hGHvJXOYKnLmea67H7ES4zVi-aBYcquIzXdAE1IMlvqgRZIrK3lDnS6X7bFQzdCd4hs0bnKutTLhZS4F4jFF
Purdue University, Center for Commercial Agriculture, The Iran Conflict, Energy Prices, and U.S. Farm Profitability: A Balanced Assessment, 31 Mar 2026
https://ag.purdue.edu/commercialag/home/paer-article/the-iran-conflict-energy-prices-and-u-s-farm-profitability-a-balanced-assessment/
Moody’s: Colorado River deadlock raises likelihood of federal intervention, litigation uncertainty | Sector In-Depth | Moody’s
S&P: “Dry Run: The High Stakes Race Redefining The Colorado River’s Downstream Credit Challenges”
The Bond Buyer: “Colorado River Basin states gird for court battle over water”
The New York Times: “States Miss a Big Deadline, Ending Chance for a Colorado River Water Deal”
MMA Weekly Outlook, Colorado River Crisis Highlights Rising Credit Uncertainty, Brown and Caldwell, 02 Mar 2026
The Bond Buyer: https://www.bondbuyer.com/news/washington-state-governor-signs-millionaires-tax-into-law
WSJ: https://www.wsj.com/politics/policy/washington-state-adopts-new-tax-on-incomes-over-1-million-177baace?mod=Searchresults&pos=3&page=1
The Guardian: https://www.theguardian.com/us-news/2026/mar/31/washington-state-millionaire-tax-wealth
Medians - New Jersey local governments show economic growth and stable reserves
U.S. Local Governments Credit Brief: New Jersey School Districts Means And Medians
New Jersey Department of Education State Aid Summaries
“The Impact of the 2018 Revision of New Jersey’s School Aid Formula on School Districts’ Finances and Performance” Rutgers New Jersey State Policy Lab, June 2023
This material is not intended to be a recommendation or investment advice, does not constitute a solicitation to buy, sell or hold a security or an investment strategy, and is not provided in a fiduciary capacity. The information provided does not take into account the specific objectives or circumstances of any particular investor, or suggest any specific course of action. Investment decisions should be made based on an investor’s objectives and circumstances and in consultation with his or her financial professionals.
The views and opinions expressed are for informational and educational purposes only as of the date of production/writing and may change without notice at any time based on numerous factors, such as market or other conditions, legal and regulatory developments, additional risks and uncertainties and may not come to pass. This material may contain “forward-looking” information that is not purely historical in nature. Such information may include, among other things, projections, forecasts, estimates of market returns, and proposed or expected portfolio composition. Any changes to assumptions that may have been made in preparing this material could have a material impact on the information presented herein by way of example. Performance data shown represents past performance and does not predict or guarantee future results. Investing involves risk; principal loss is possible.
All information has been obtained from sources believed to be reliable, but its accuracy is not guaranteed. There is no representation or warranty as to the current accuracy, reliability or completeness of, nor liability for, decisions based on such information and it should not be relied on as such. For term definitions and index descriptions, please access the glossary on nuveen.com. Please note, it is not possible to invest directly in an index.
Important information on risk
Investing involves risk; principal loss is possible. All investments carry a certain degree of risk and there is no assurance that an investment will provide positive performance over any period of time. Investing in municipal bonds involves risks such as interest rate risk, credit risk and market risk. The value of the portfolio will fluctuate based on the value of the underlying securities. There are special risks associated with investments in high yield bonds, hedging activities and the potential use of leverage. Portfolios that include lower rated municipal bonds, commonly referred to as “high yield” or “junk” bonds, which are considered to be speculative, the credit and investment risk is heightened for the portfolio. Bond insurance guarantees only the payment of principal and interest on the bond when due, and not the value of the bonds themselves, which will fluctuate with the bond market and the financial success of the issuer and the insurer. No representation is made as to an insurer’s ability to meet their commitments.
This information should not replace an investor’s consultation with a financial professional regarding their tax situation. Nuveen is not a tax advisor. Investors should contact a tax professional regarding the appropriateness of tax-exempt investments in their portfolio. If sold prior to maturity, municipal securities are subject to gain/losses based on the level of interest rates, market conditions and the credit quality of the issuer. Income may be subject to the alternative minimum tax (AMT) and/or state and local taxes, based on the state of residence. Income from municipal bonds held by a portfolio could be declared taxable because of unfavorable changes in tax laws, adverse interpretations by the Internal Revenue Service or state tax authorities, or noncompliant conduct of a bond issuer. It is important to review your investment objectives, risk tolerance and liquidity needs before choosing an investment style or manager.
Nuveen, LLC provides investment solutions through its investment specialists.
This information does not constitute investment research as defined under MiFID.
